Overview of Soveren's functionality
Soveren provides several views, most of which are self-explanatory. Here is a brief summary of what you can find on them. The pictures below are examples to convey the general idea; they are regularly updated to reflect the ongoing product enhancements.
Dashboard
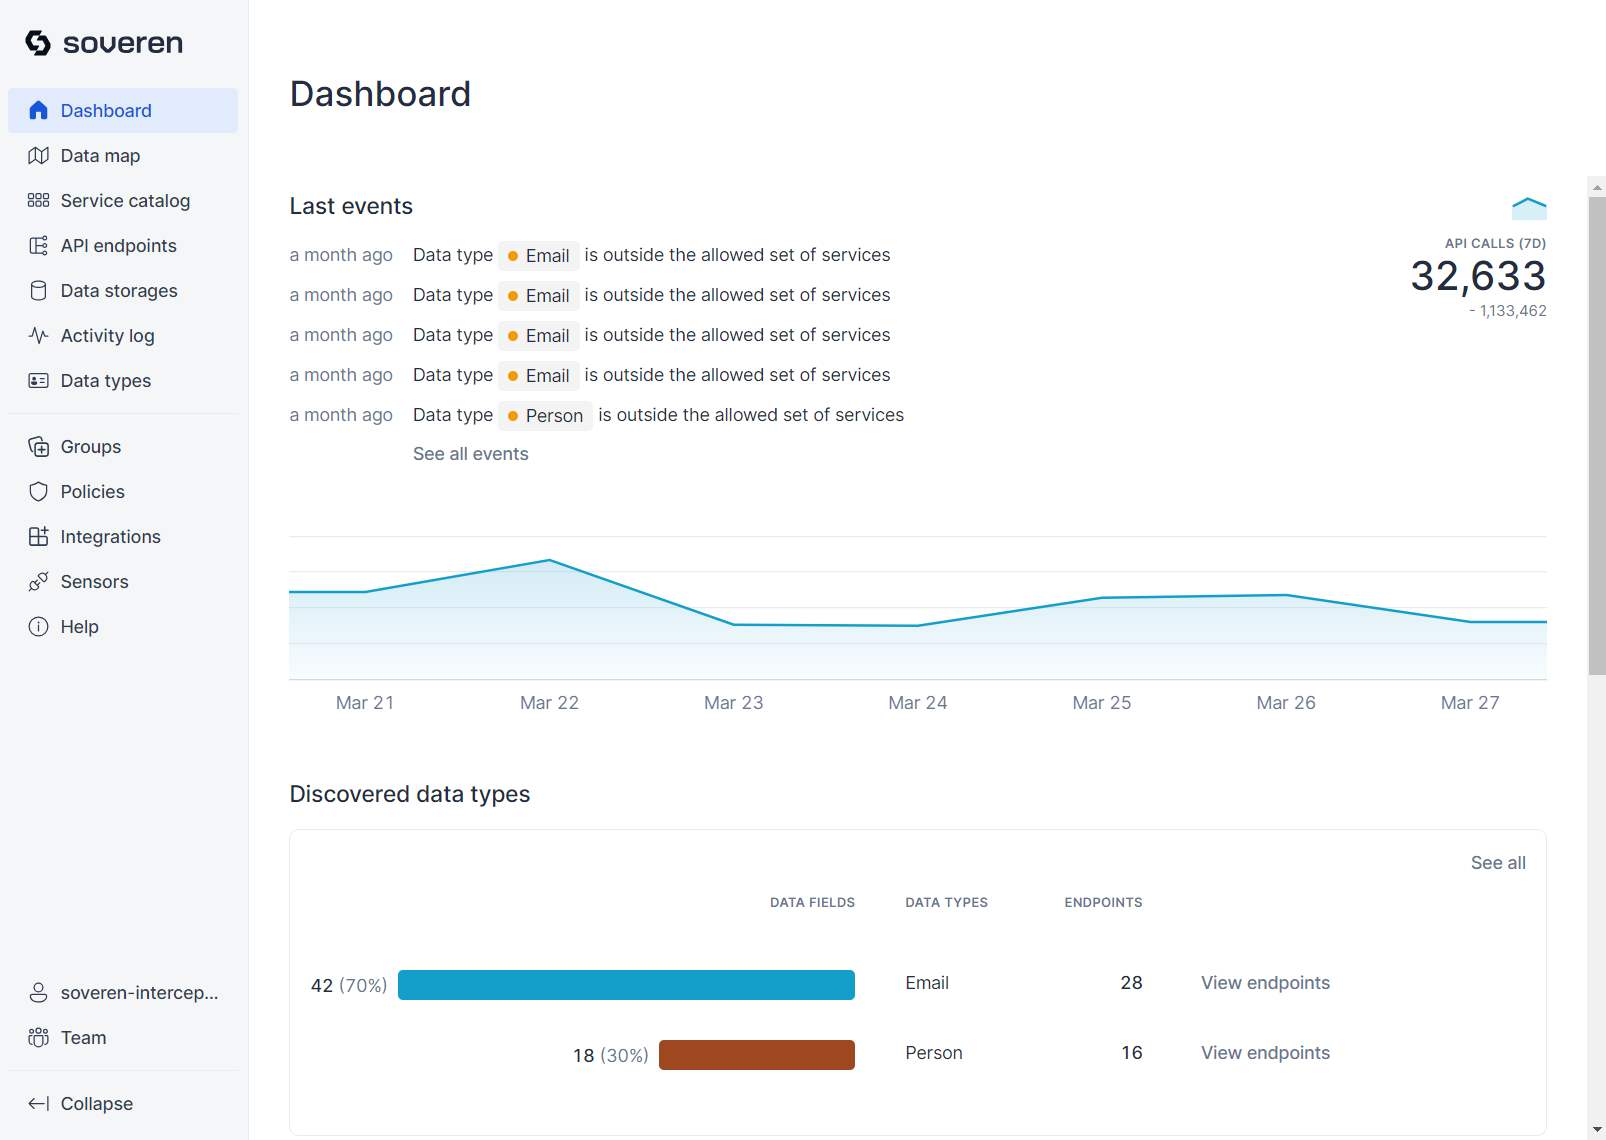
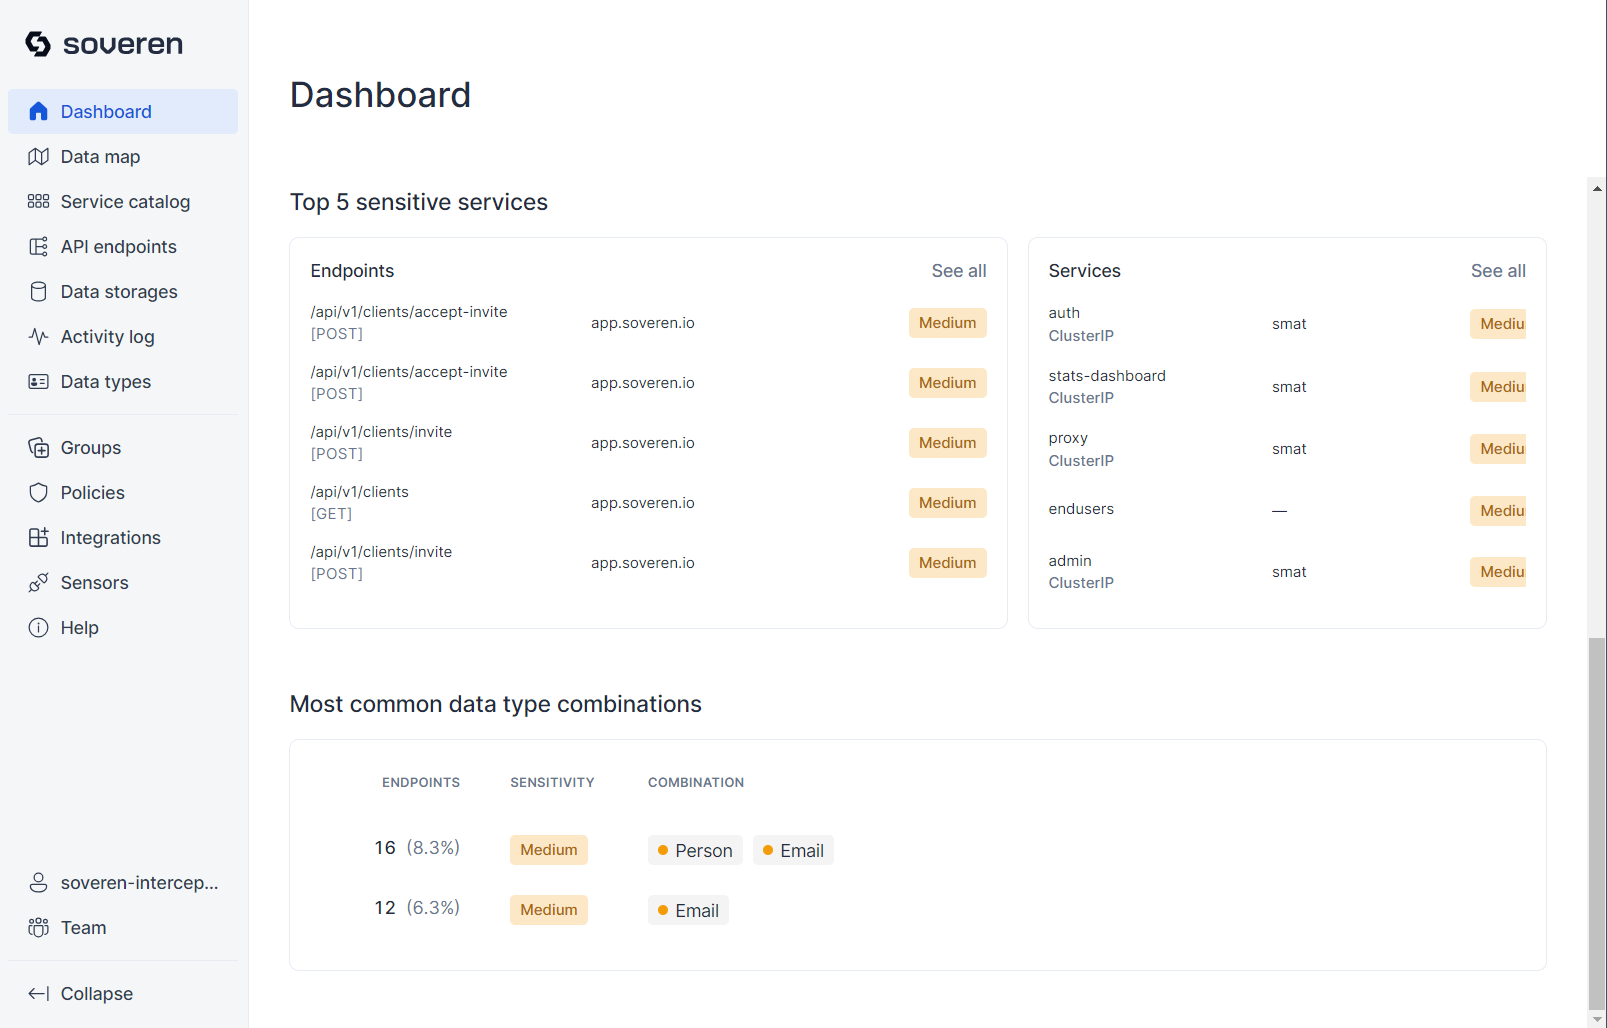
The overview Dashboard offers a 7-day summary of statistics, highlighting recent activities in your infrastructure. It displays important recent events, the number of events during the period, discovered data types, the most sensitive services, and the most common data type combinations.
The statistics show the current counts of events, services, endpoints, etc., and highlight changes compared to the previous period.
The sensitivity of each discovered data type is indicated by color: red signifies high sensitivity, yellow indicates moderate sensitivity, and green suggests low sensitivity — unless combined with other data types, increasing the overall sensitivity.
Data map
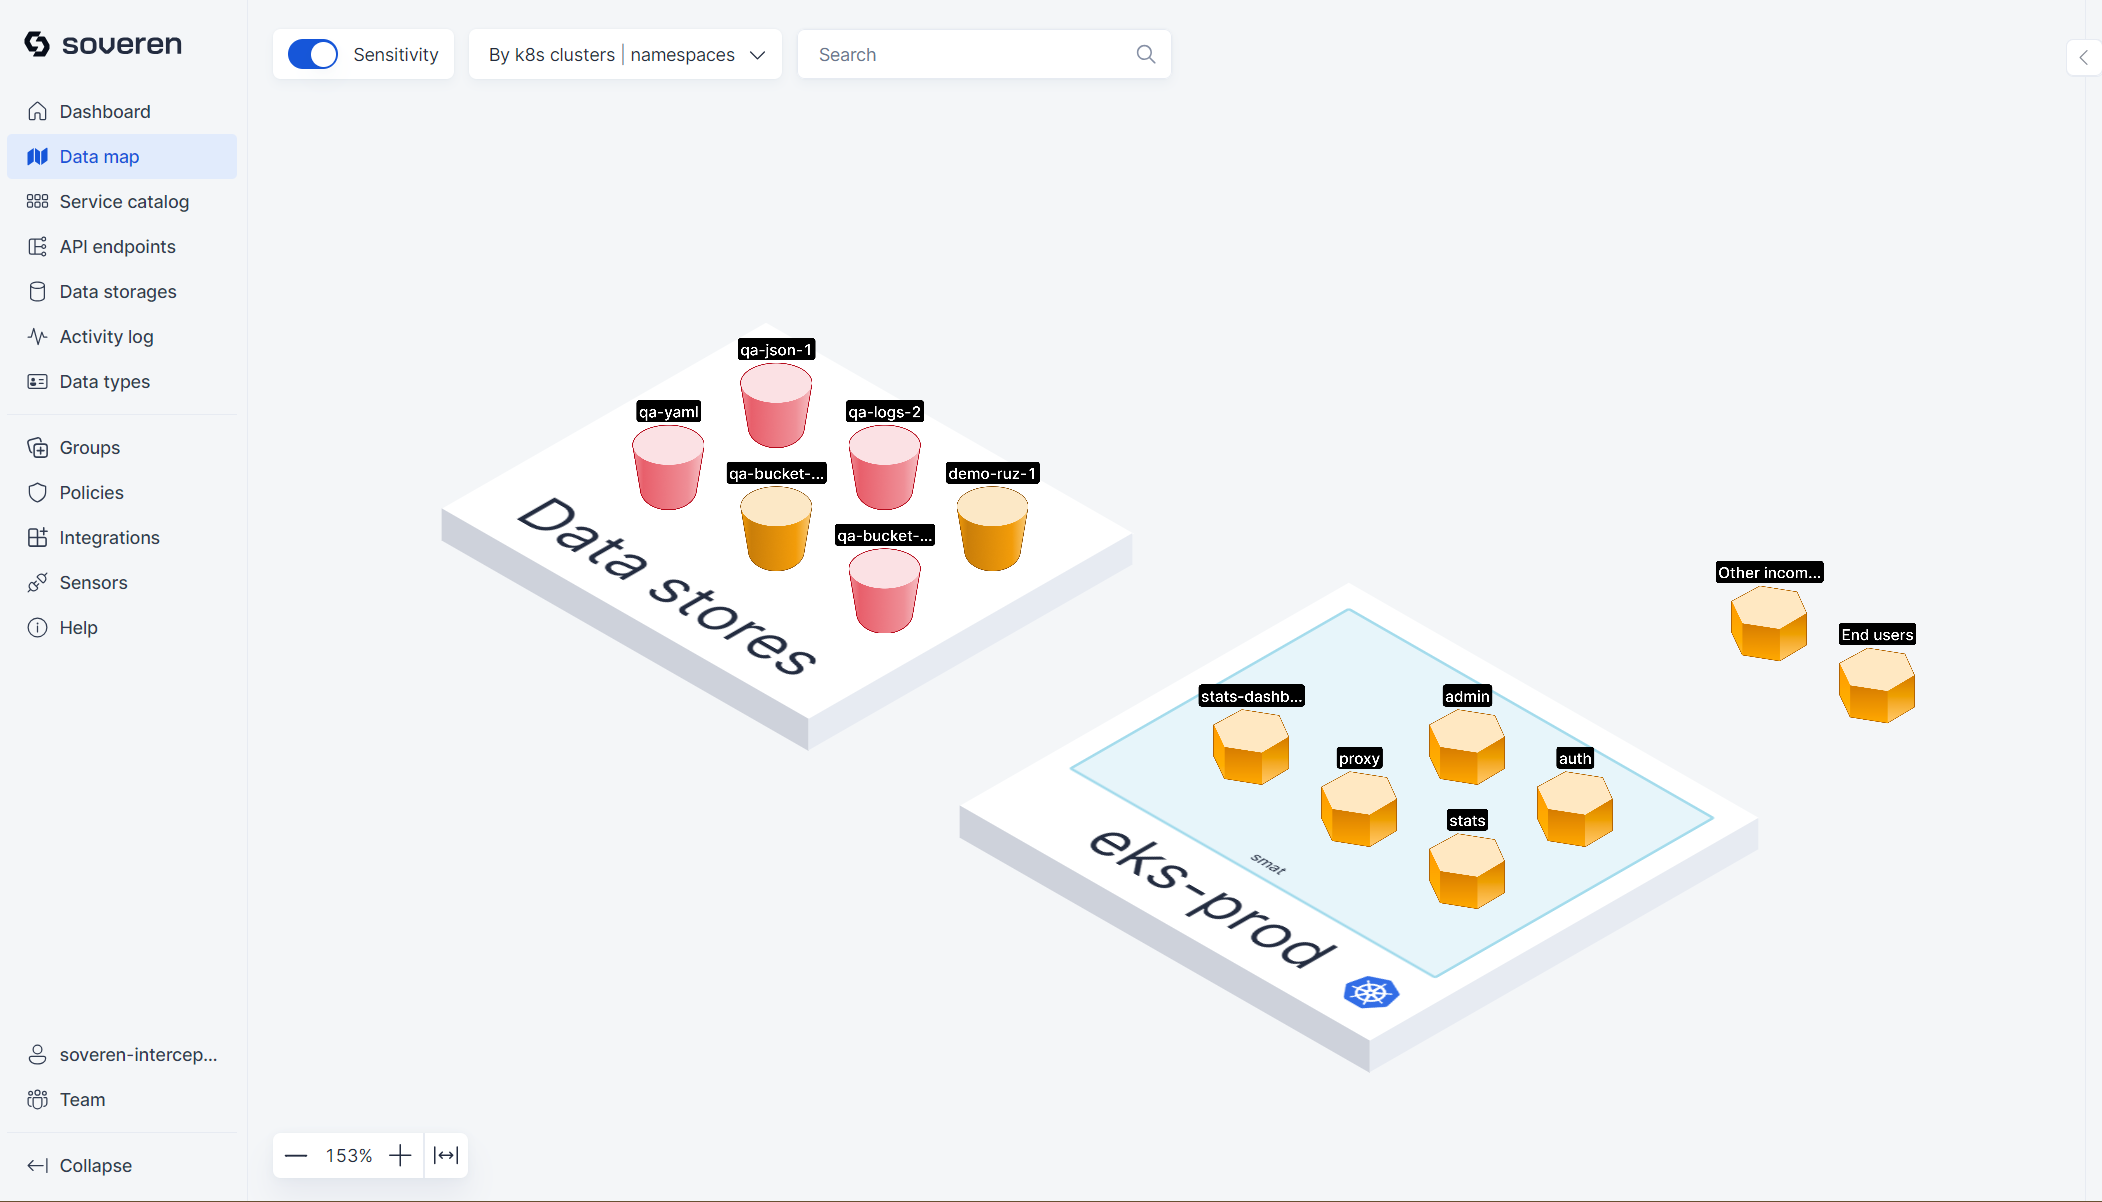
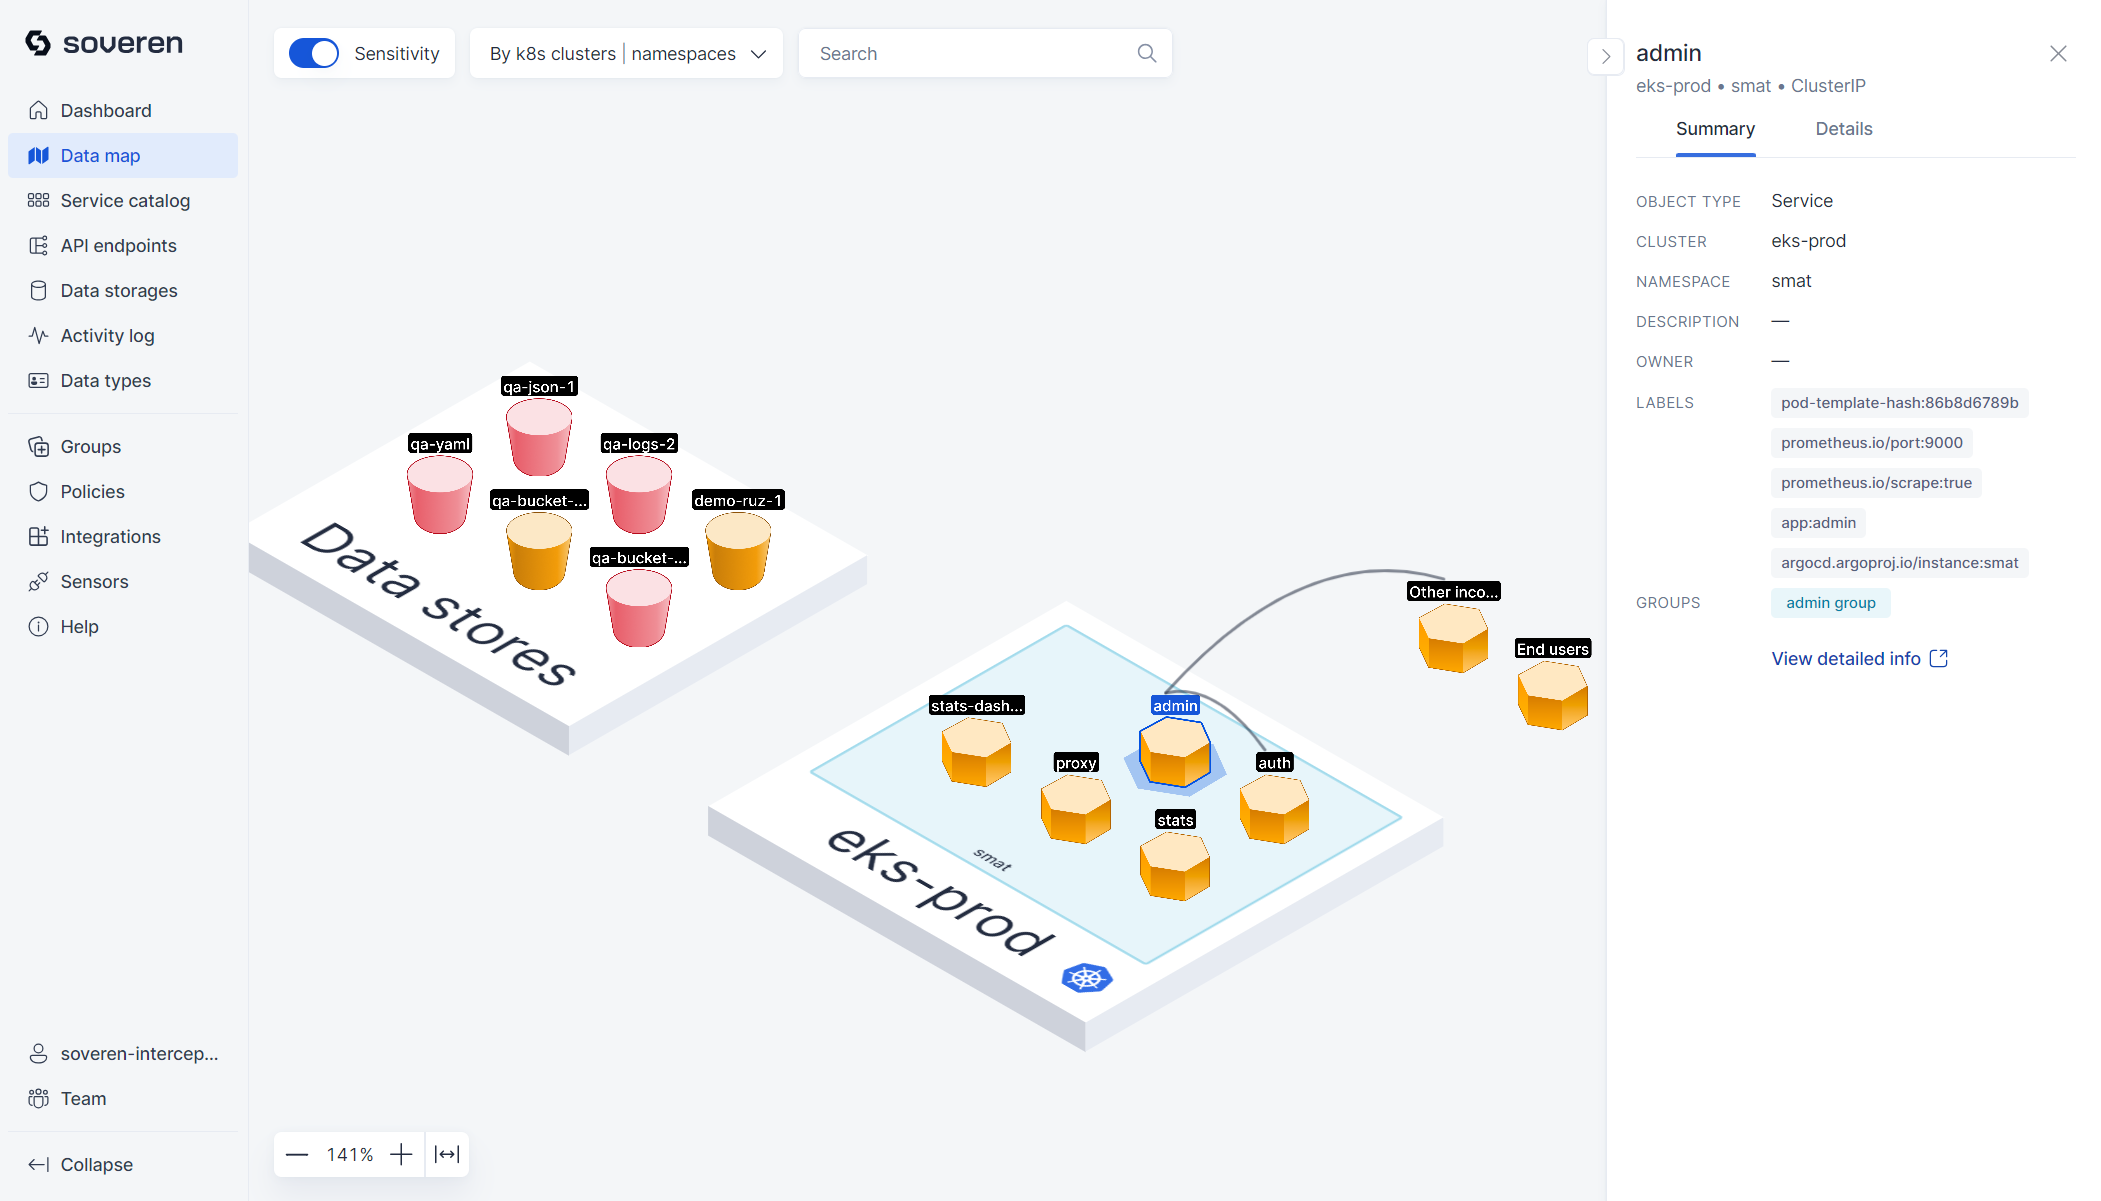
The data map provides a high-level view of your landscape. It displays all clusters where you've deployed Soveren Sensors, including all services that Soveren has identified, as well as external connections.
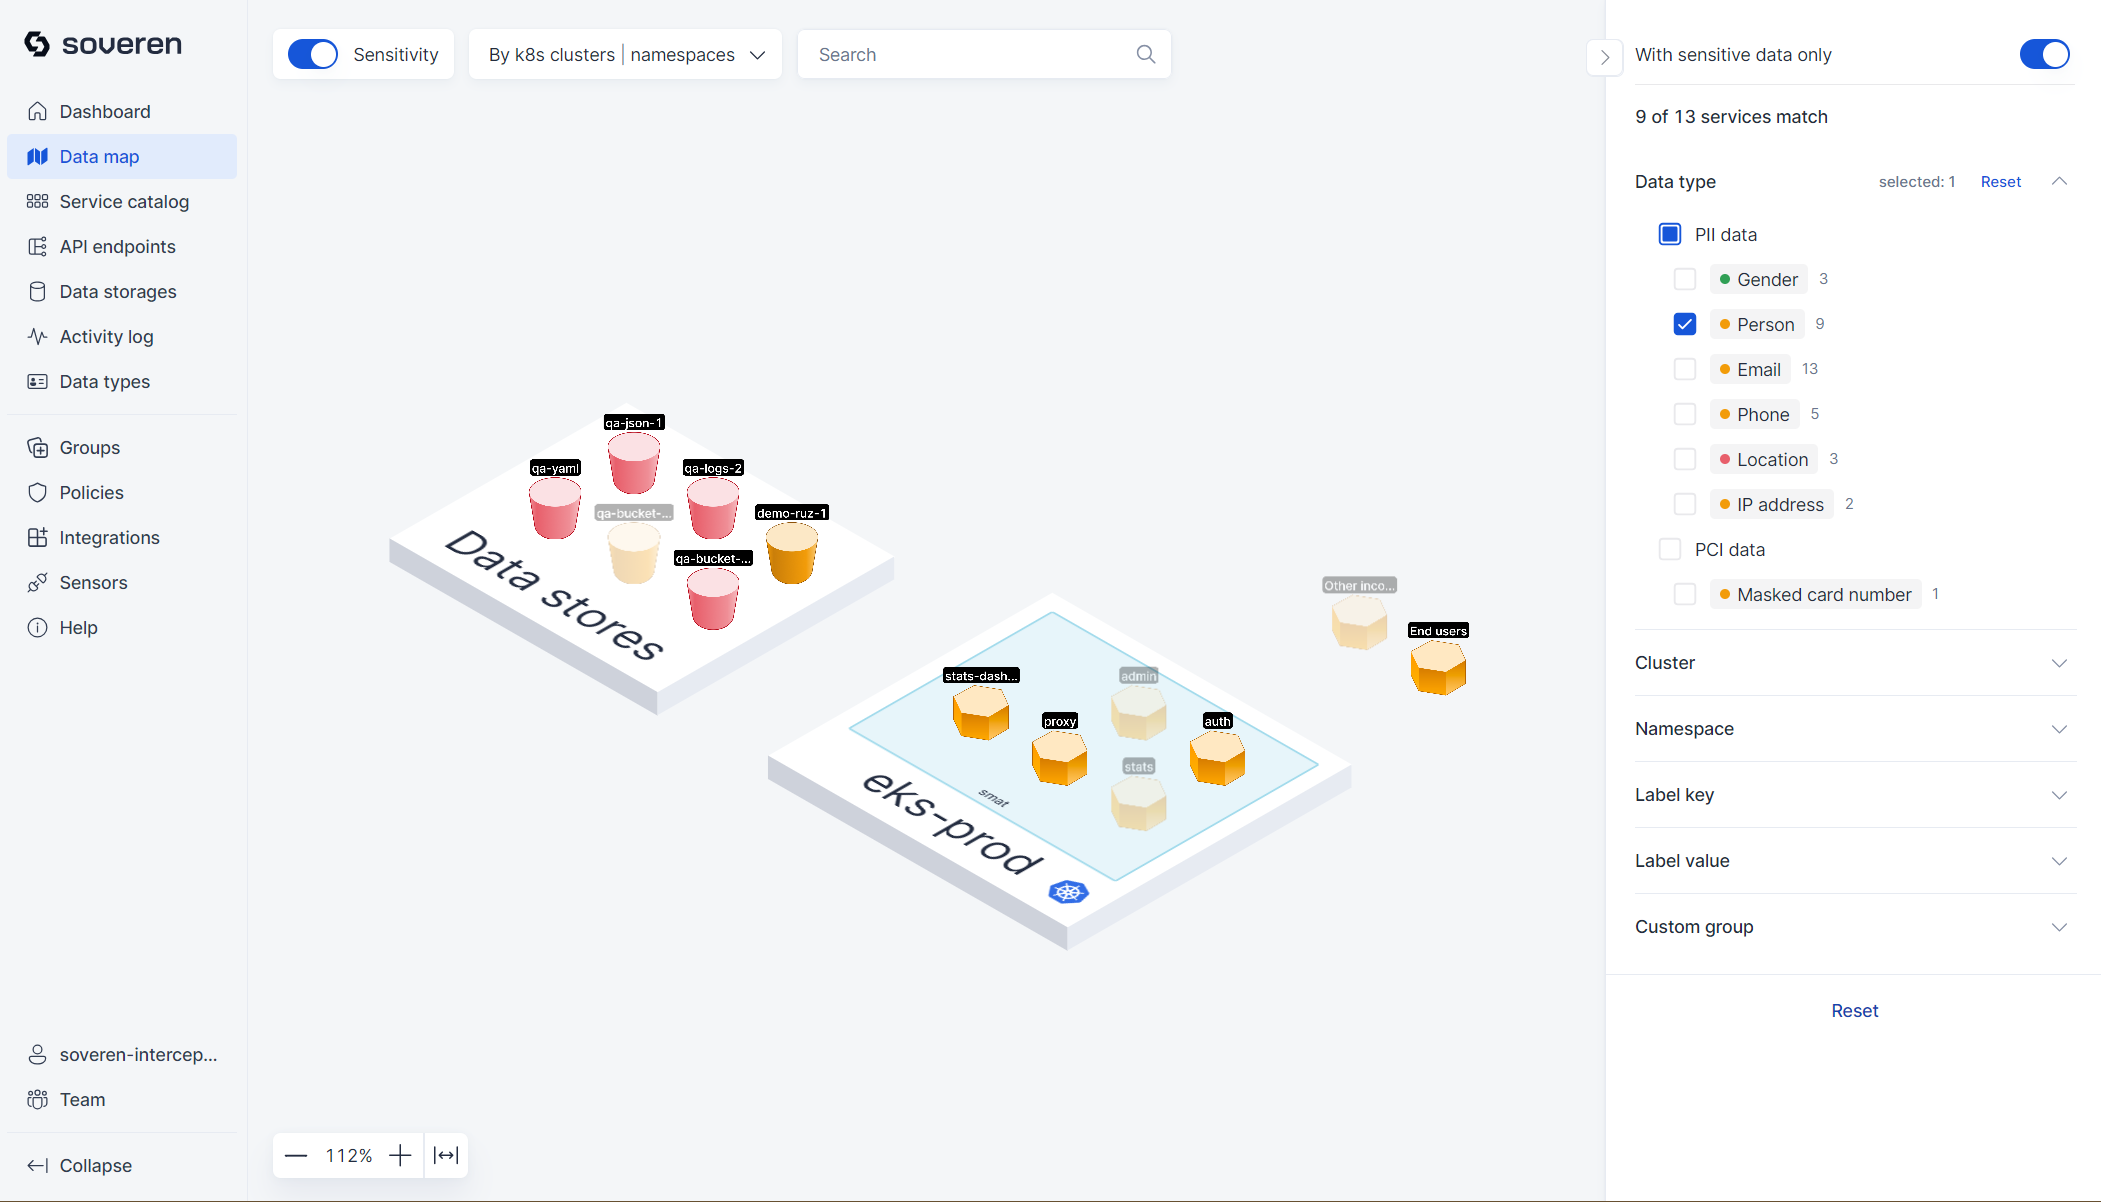
There are numerous filtering options and toggles on the map, which help in creating focused views of different parts of the infrastructure. Additionally, there is a visual representation of sensitive data types that have been detected in the services and flows.
You can also delve into individual services to examine their specific data flows and API endpoints:
Services
Service catalog
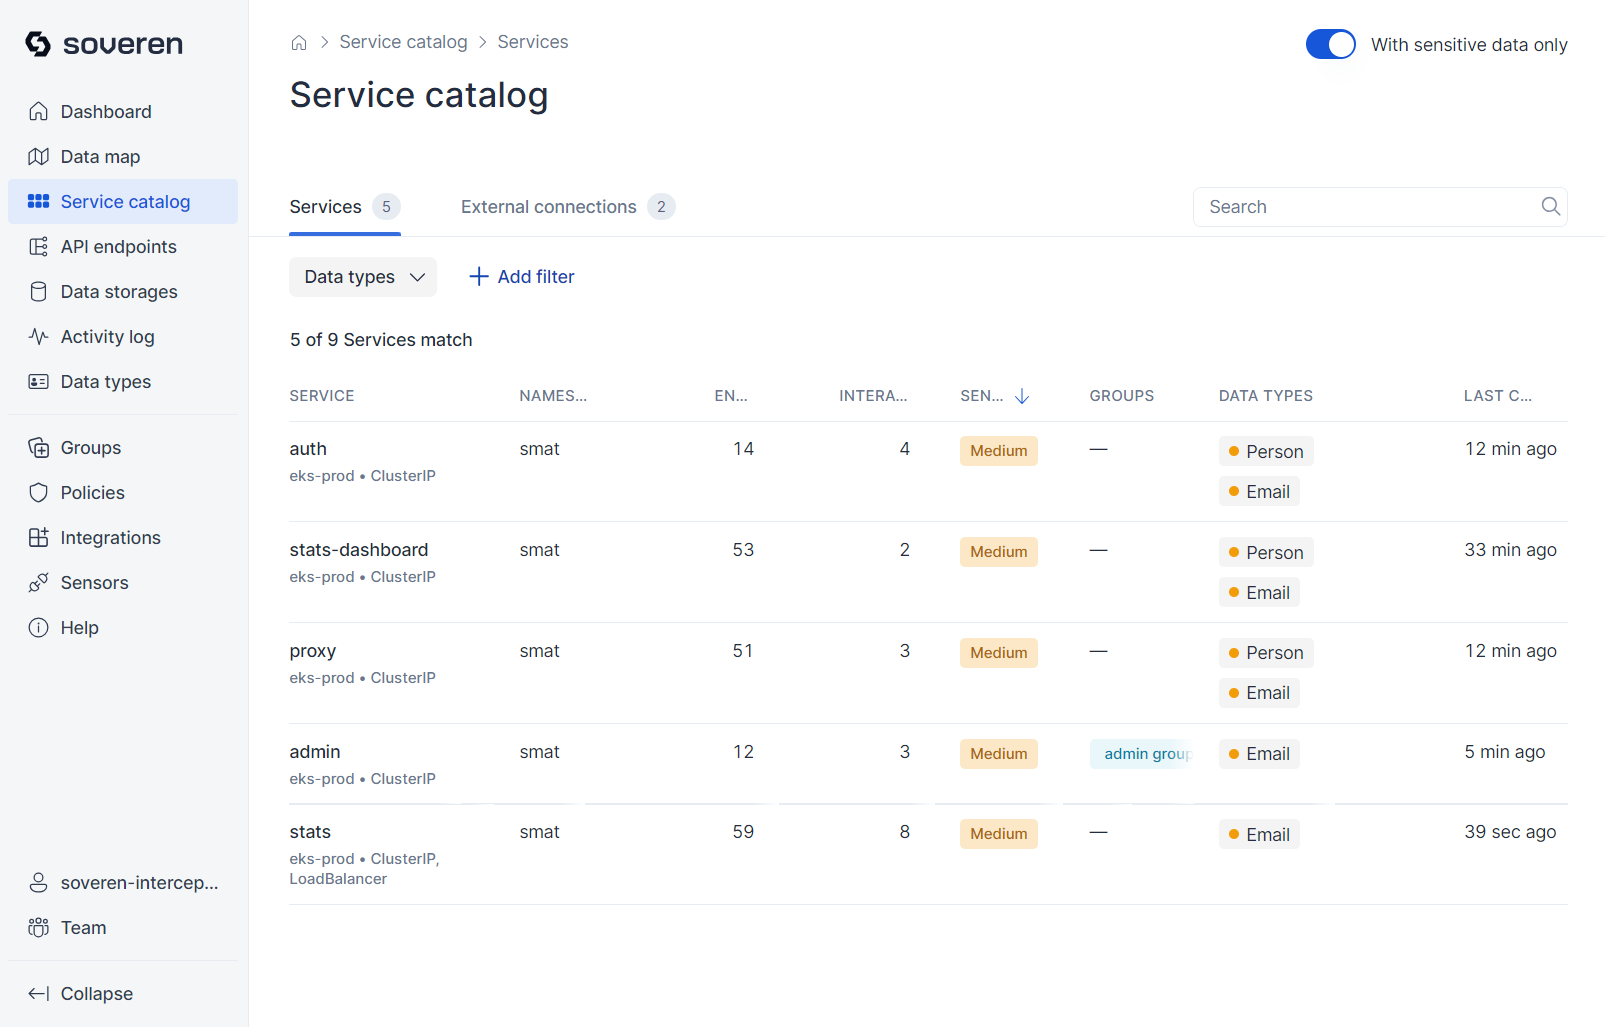
Soveren builds a service catalog while scanning traffic. This catalog includes services communicating through data flows, which may contain sensitive information. These services are not only data concentration points but are also actively interacting in real-time.
For instance, within your Kubernetes cluster, you might find services like:
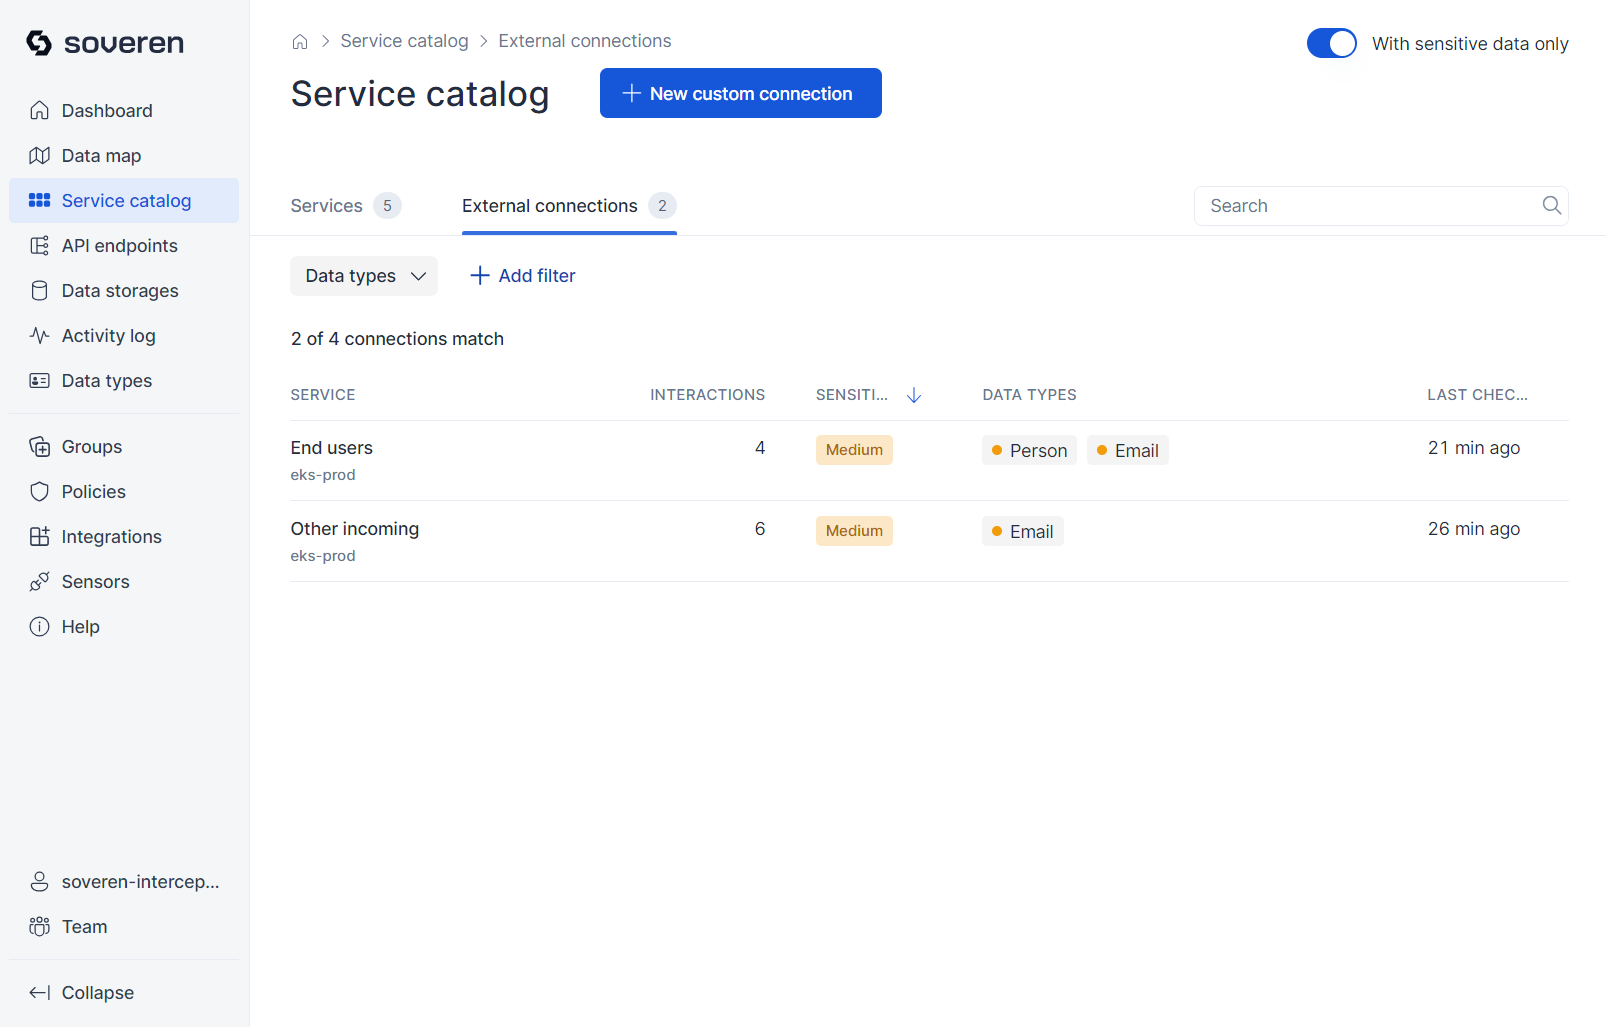
There are also external connections that these services make with third parties, such as data providers or consumers, under data processing agreements. Additionally, there might be bots scanning your resources periodically (e.g., search engine crawlers), or users accessing your applications through web browsers or mobile apps.
External connection parties can also be viewed as services, but with different properties:
Service details
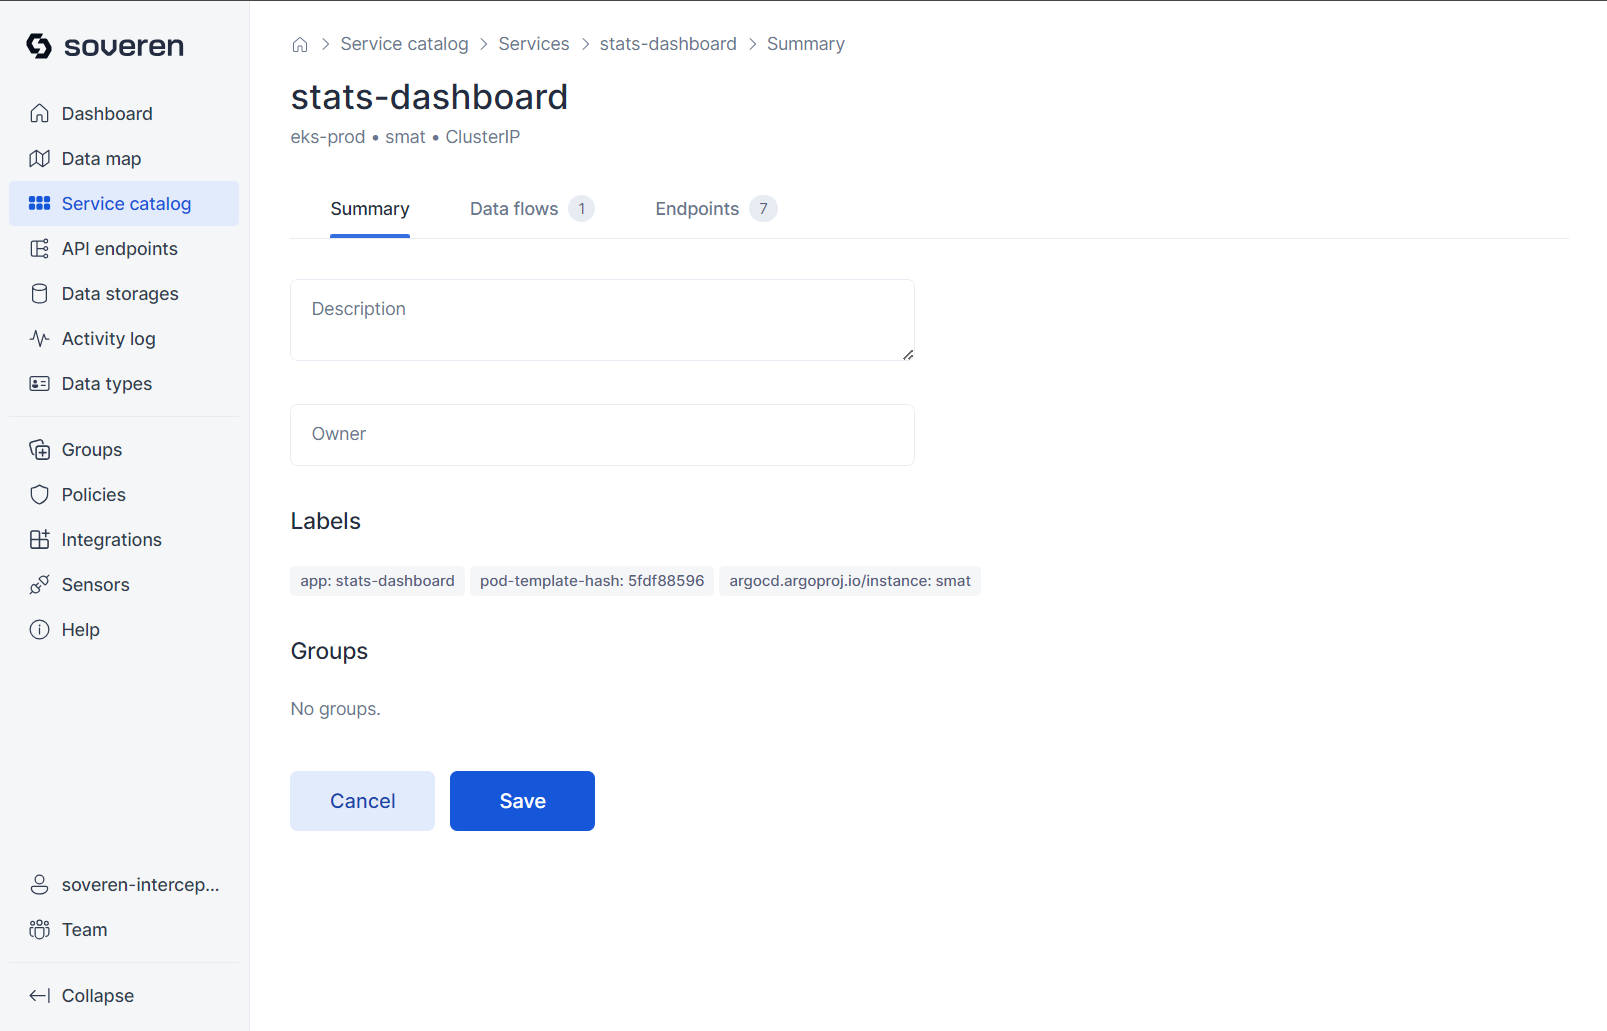
You can delve into individual services to examine associated data flows and API endpoints.
The summary provides basic information about the service:
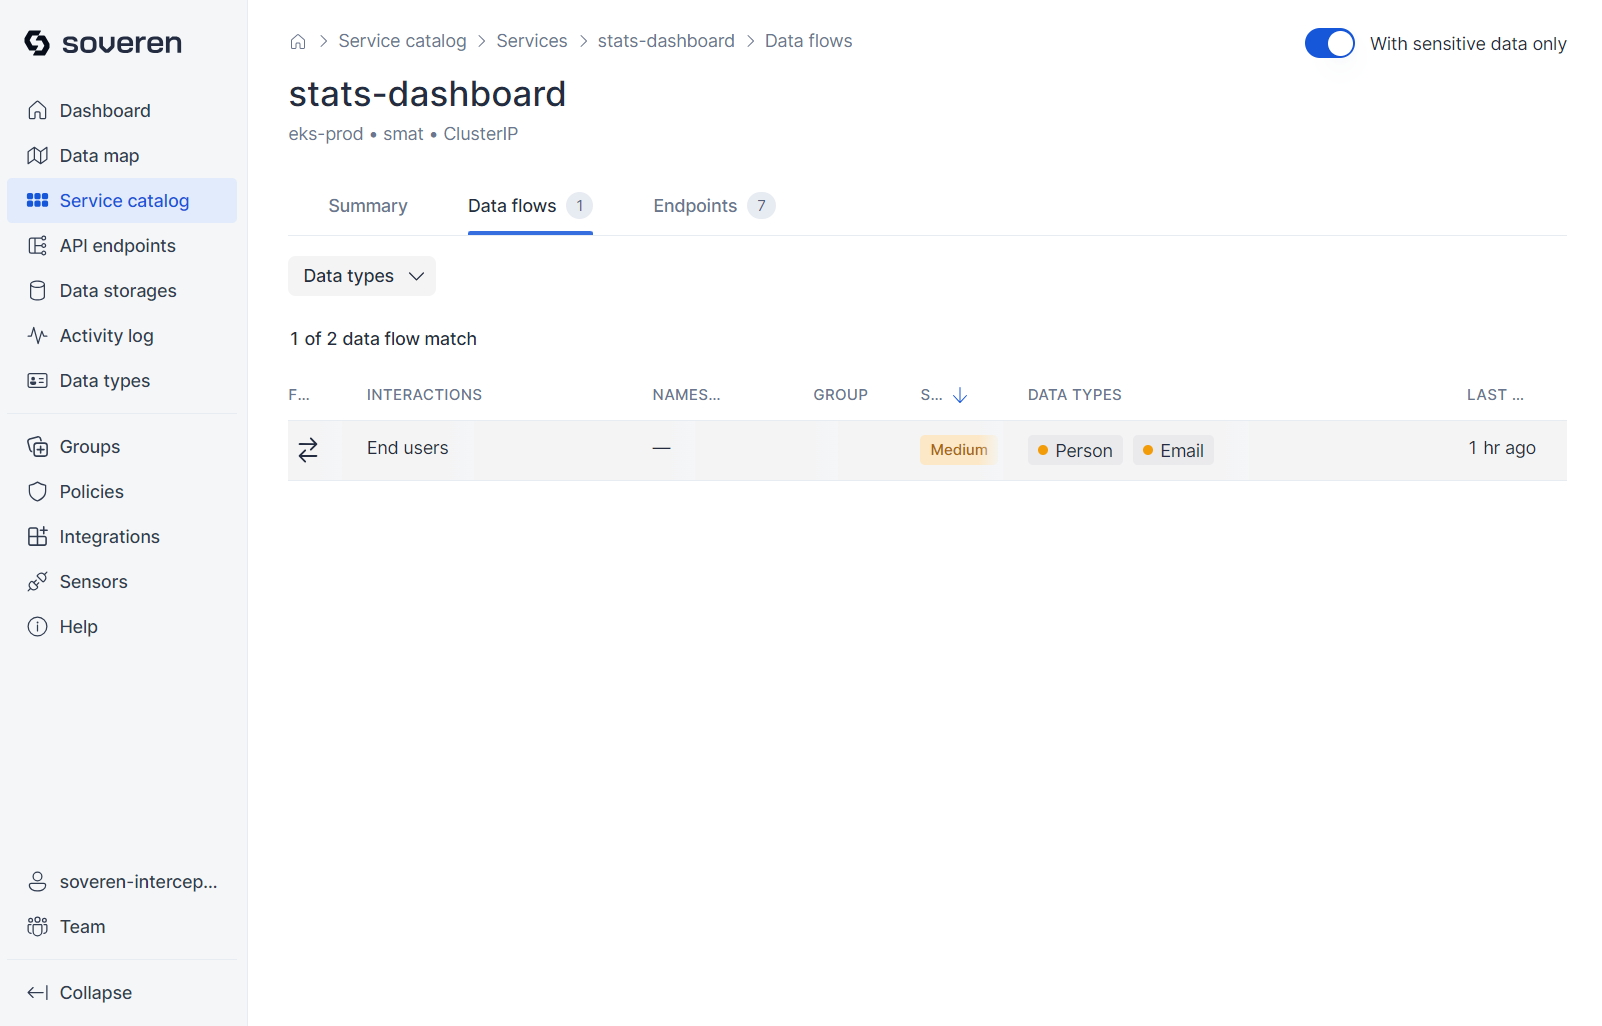
Data flows represent interactions with other services:
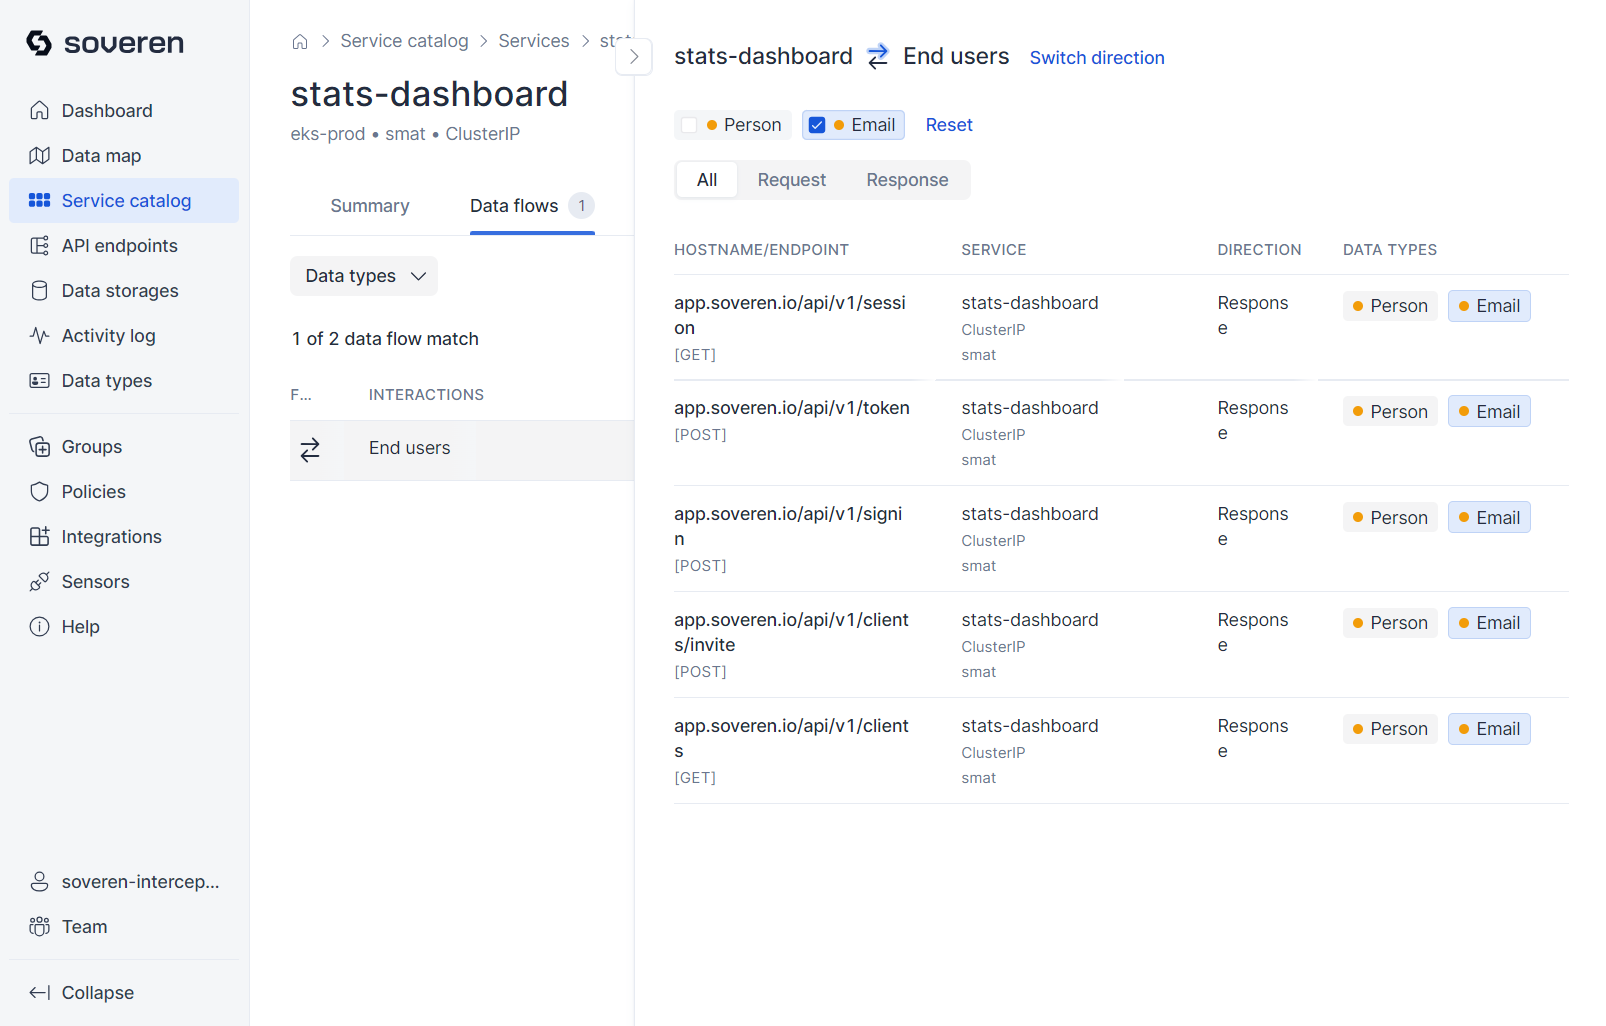
Each data flow entails multiple interactions with various API endpoints:
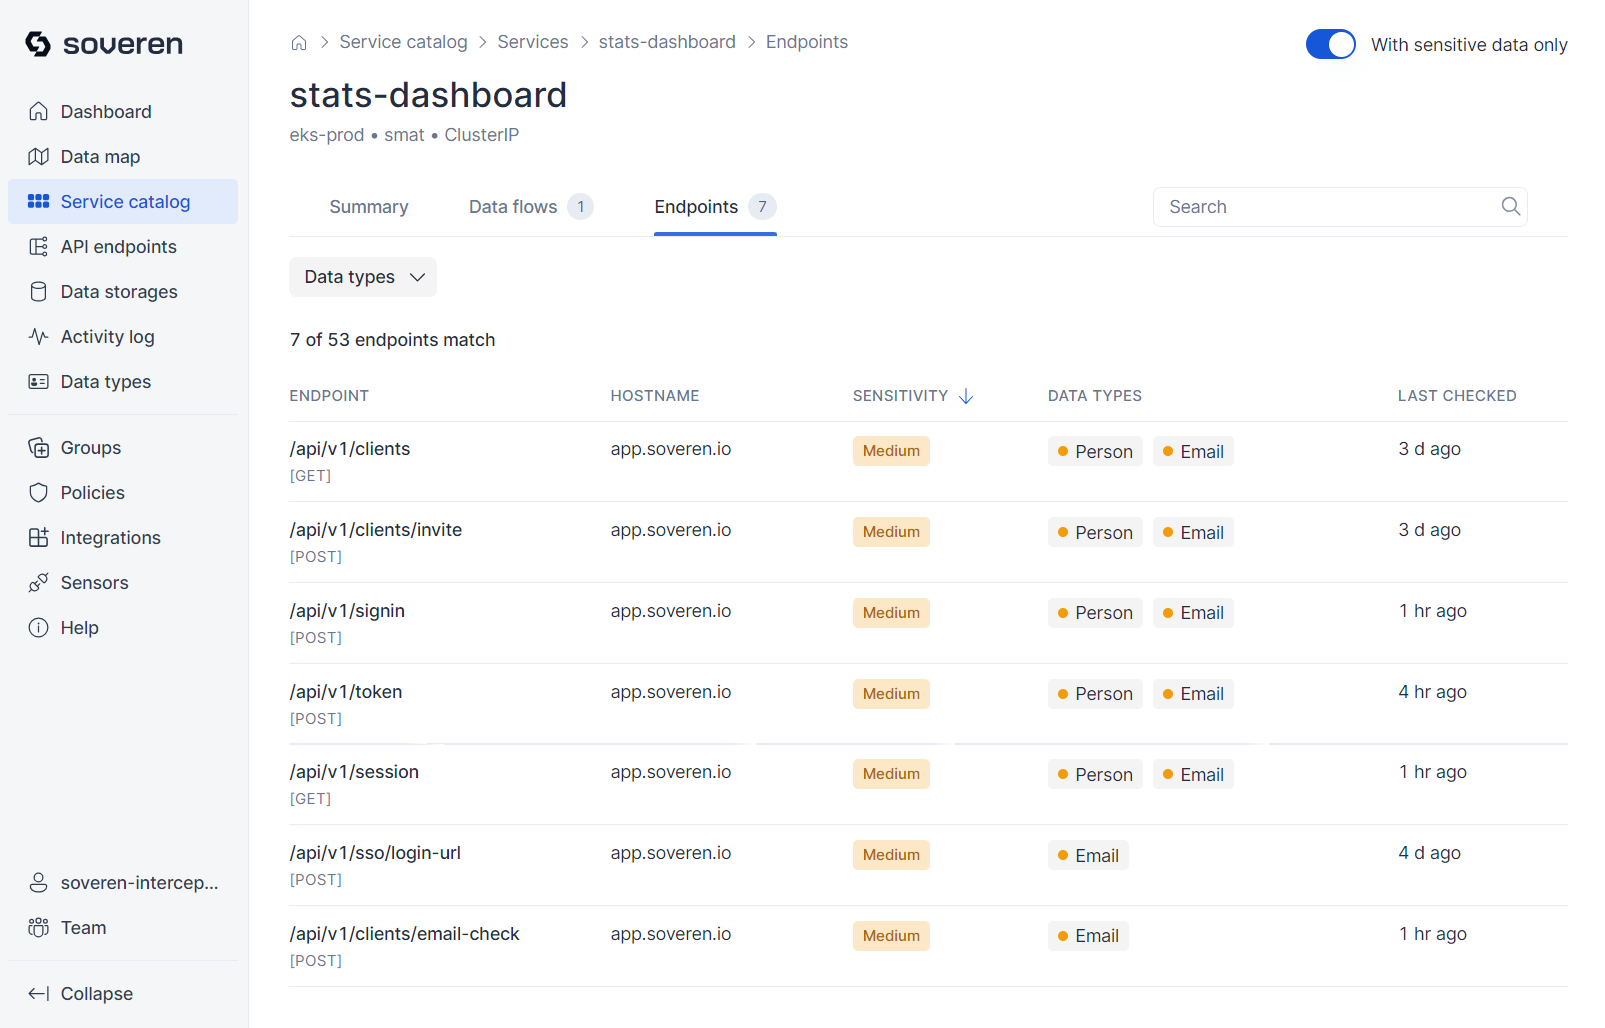
The service lists API endpoints that are actively called by other services:
External connection details
Similar views are available for external connections:
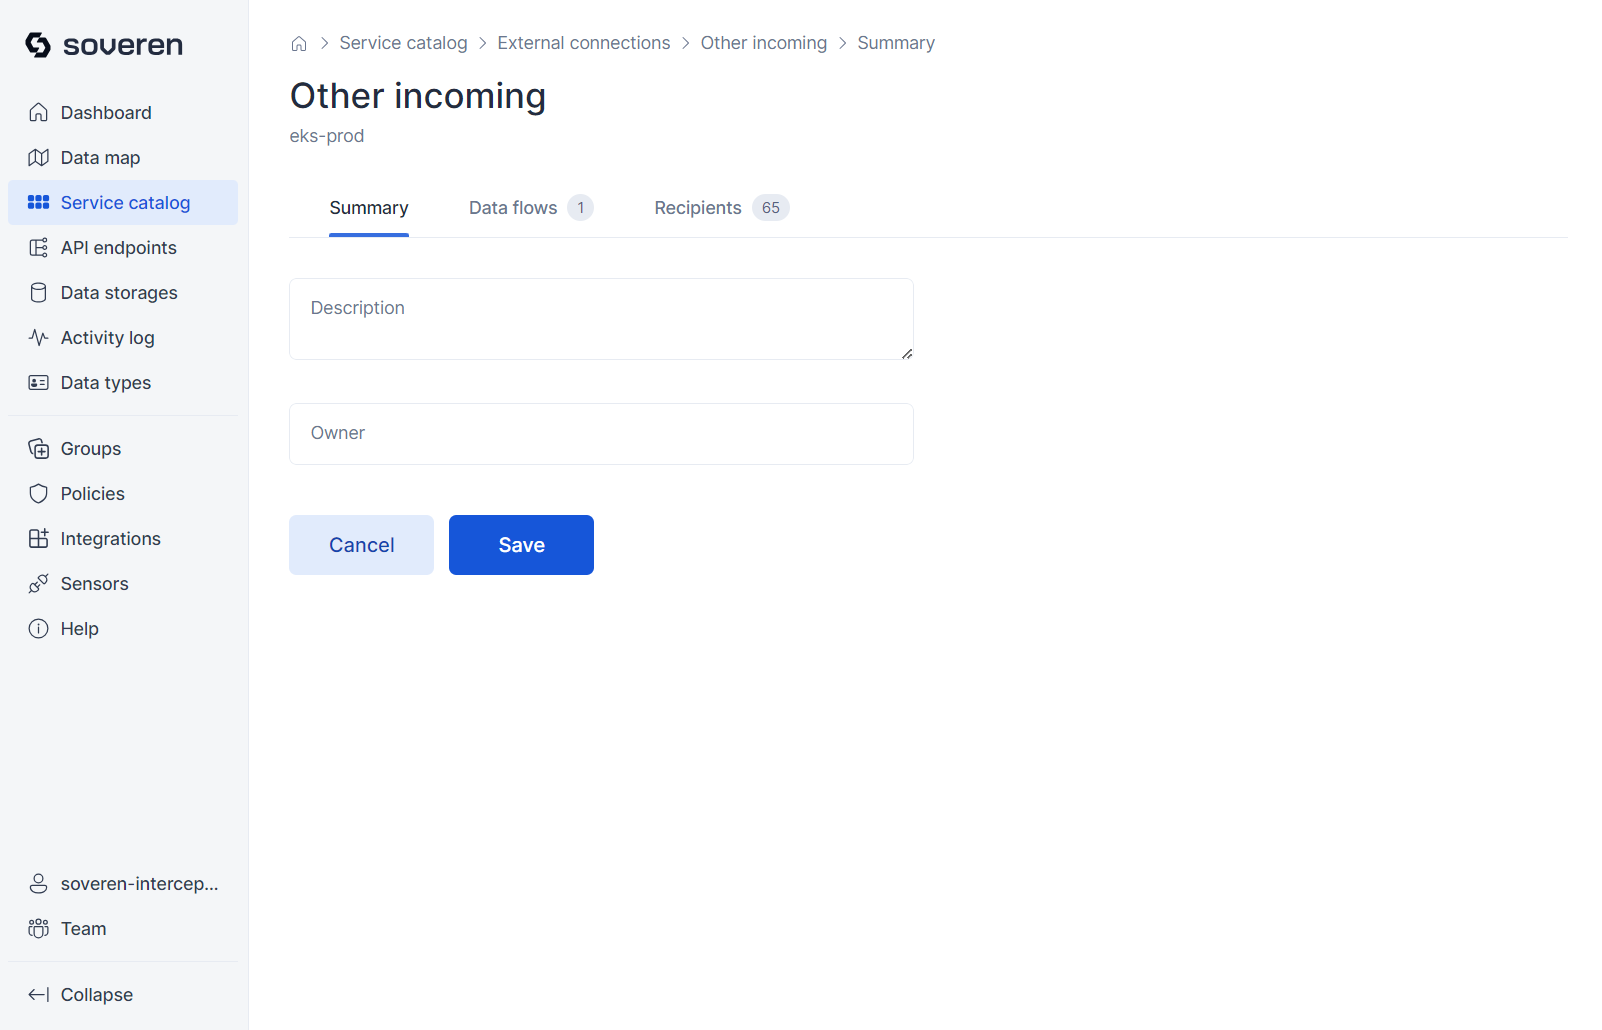
Summary of the external connection:
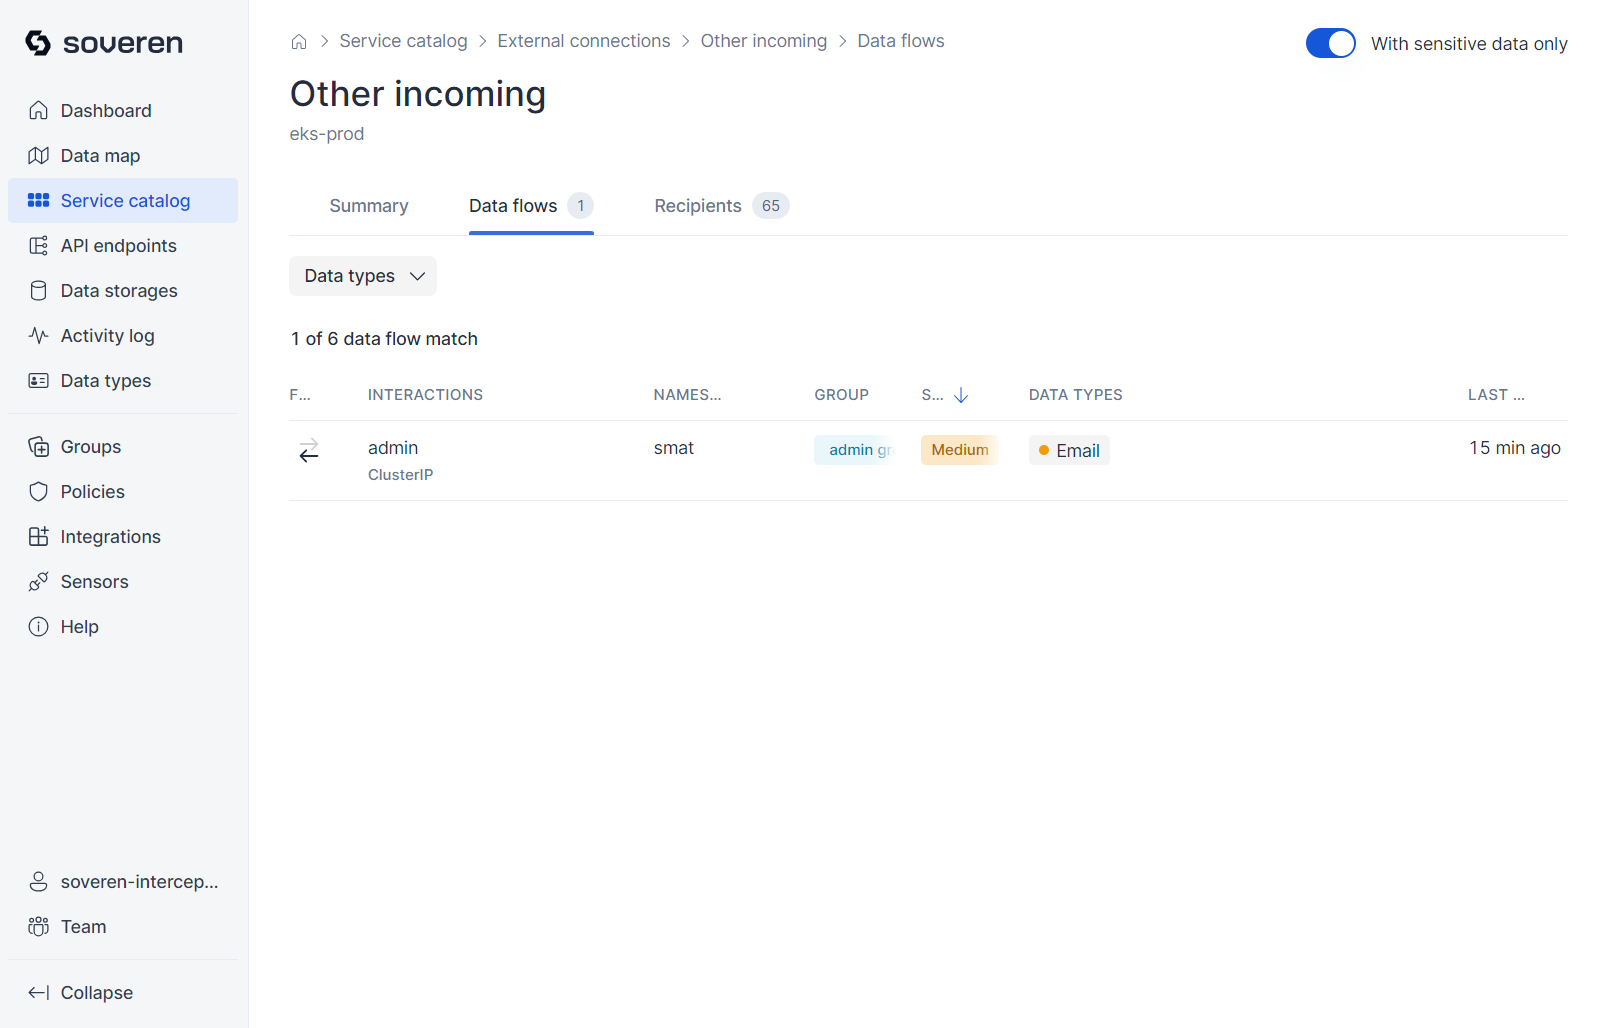
Data flows in the external connection represent its interactions with services:
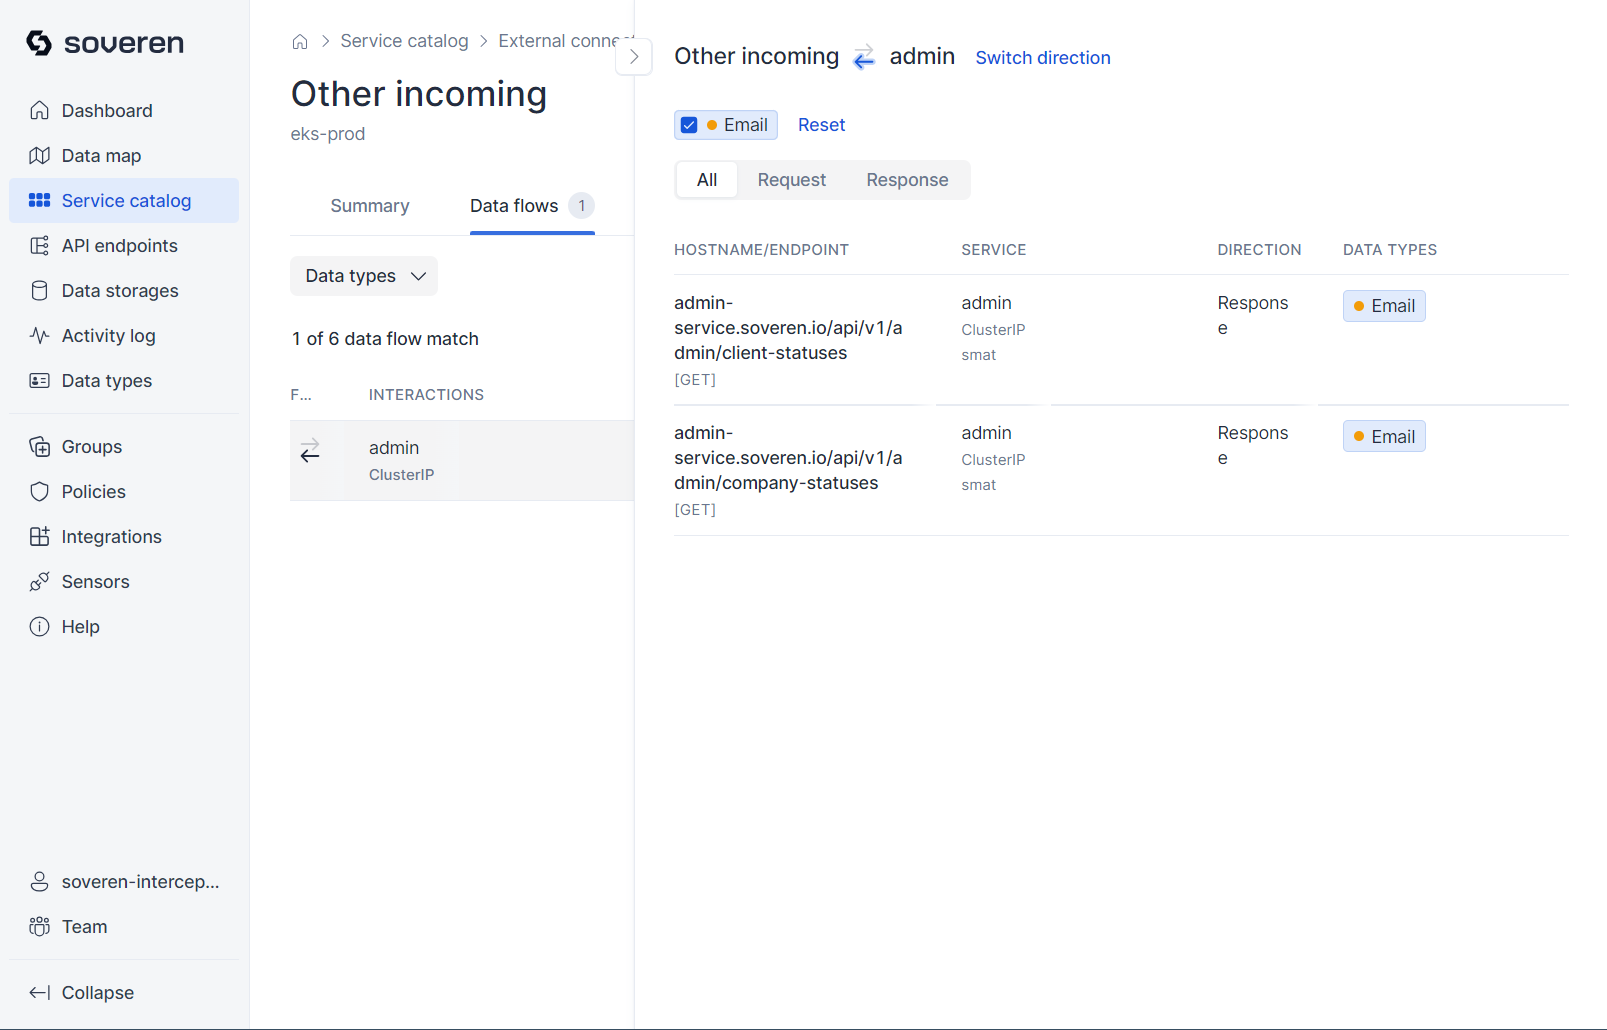
Each external connection data flow also involves multiple interactions with different API endpoints:
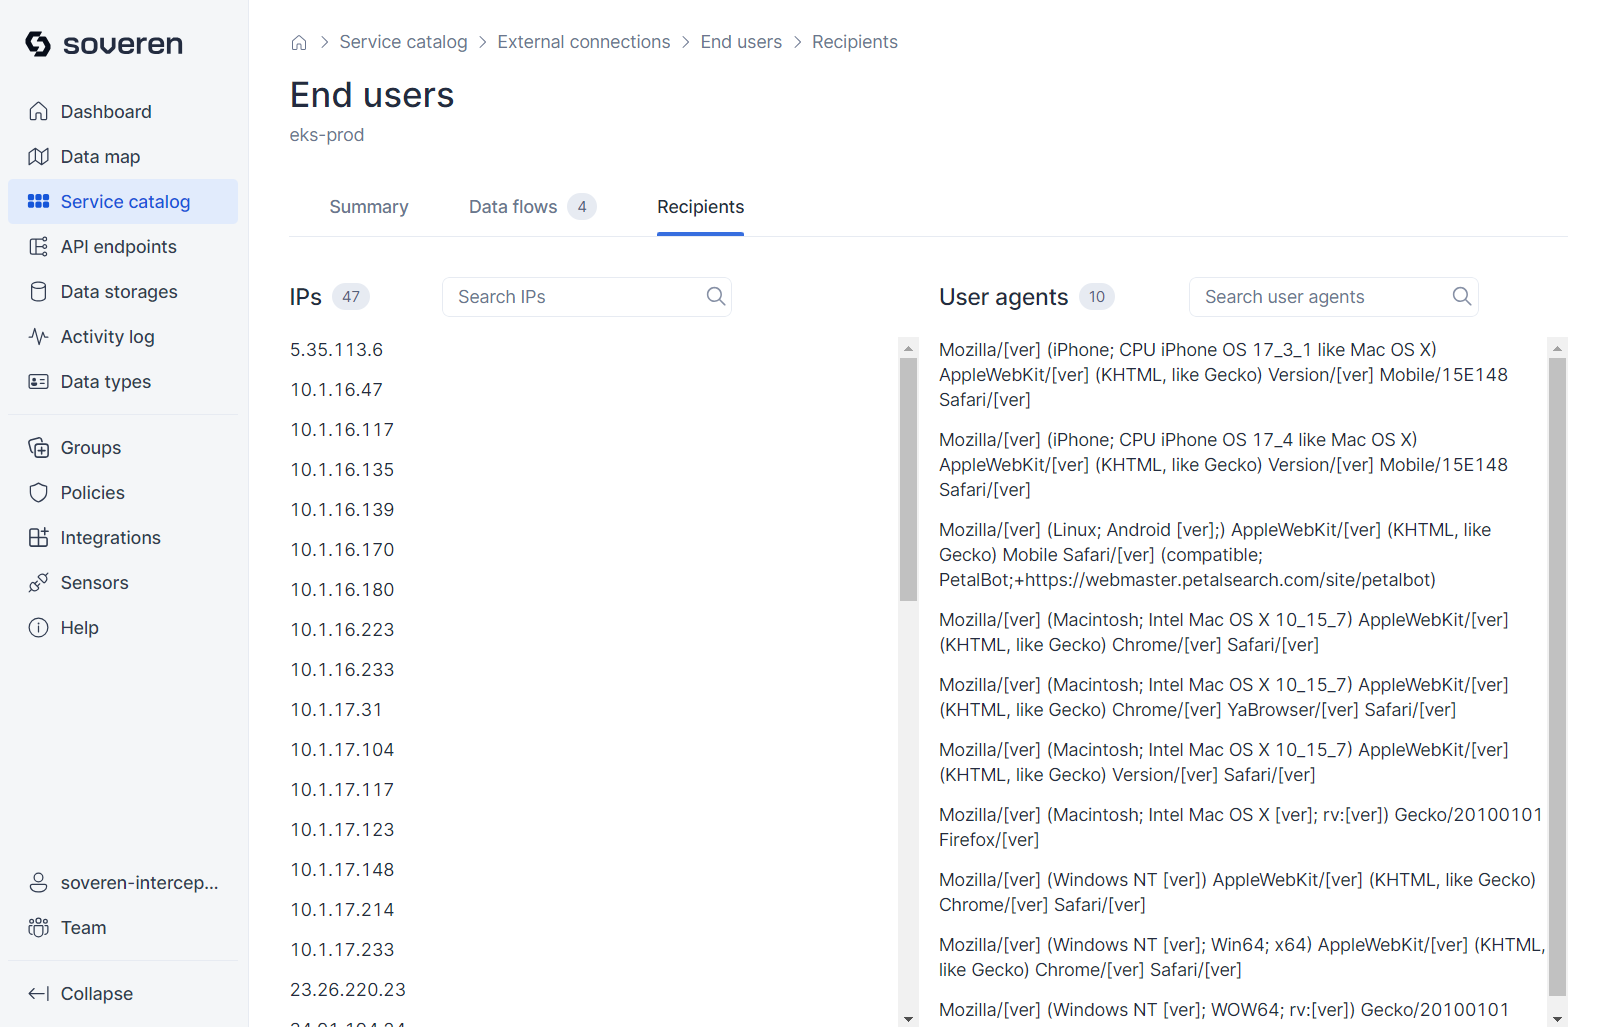
Recipients of the external connection include IP addresses and user agents that facilitate communication between services and the external connection:
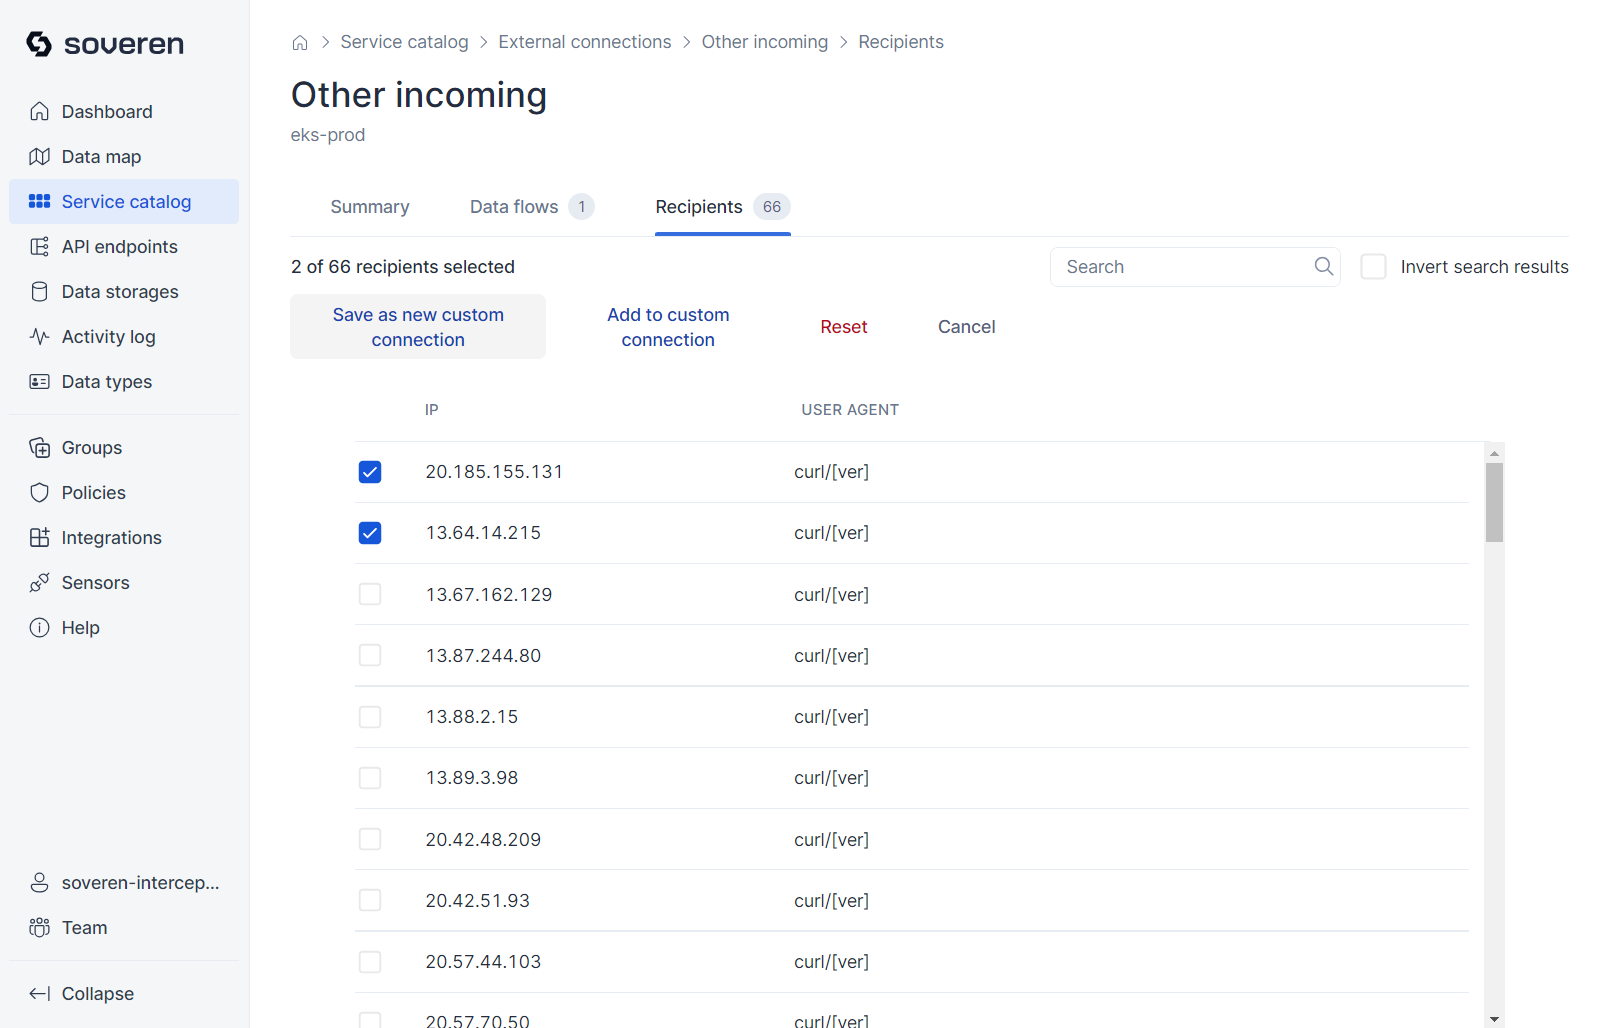
You can establish selected external connections into a custom category, for instance, by IP address. This newly created custom external connection will then be displayed separately on the data map, distinct from other external connections:
API endpoints
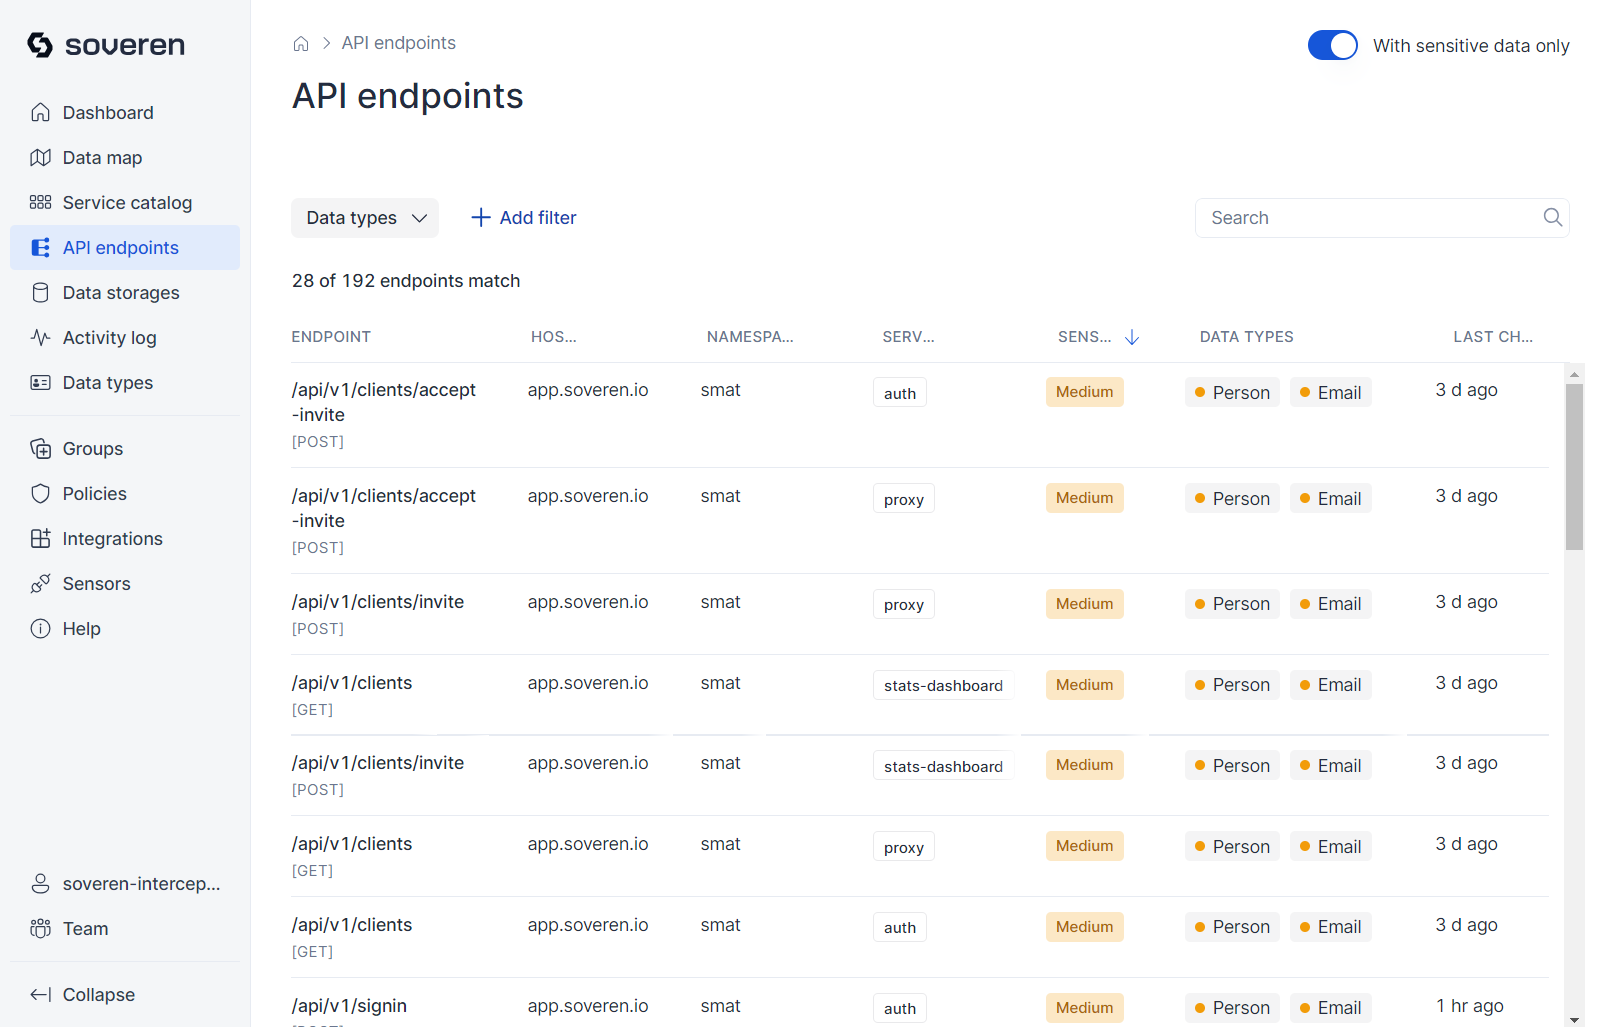
API endpoints are essentially interfaces exposed or utilized by services for data exchange, including sensitive data.
The APIs of individual services are accessible in their detailed views. For convenience, we also present a comprehensive list of all API endpoints identified by Soveren in a separate view:
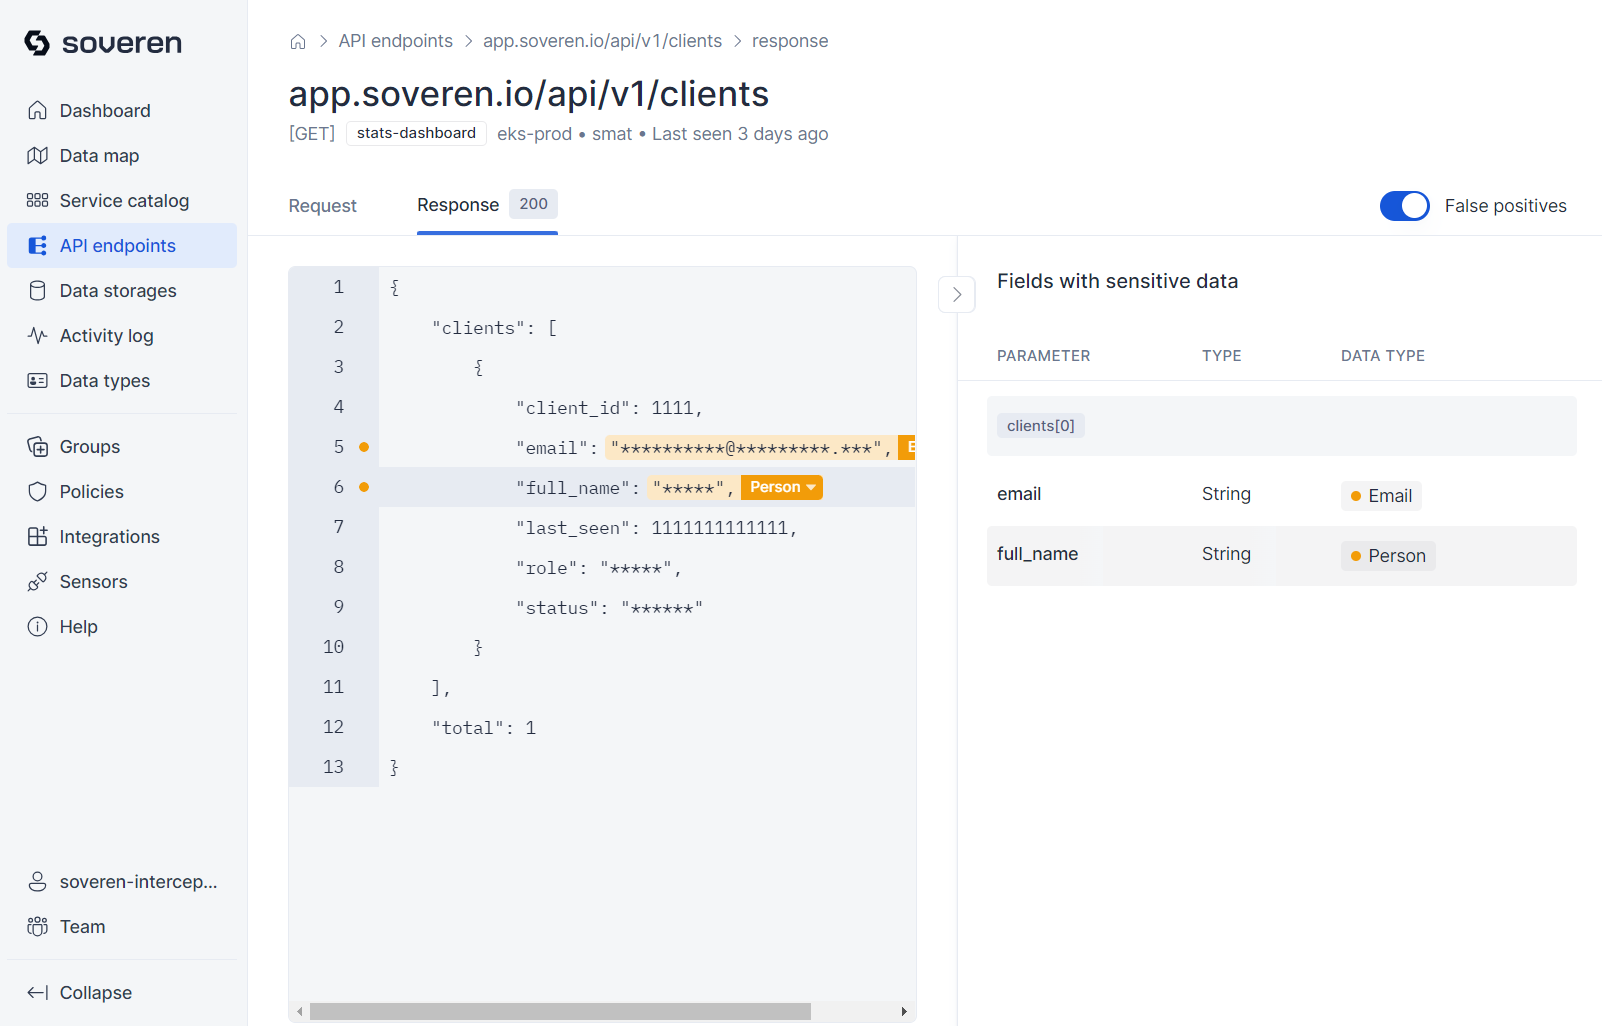
You can proceed to view a sample of data flowing to or from the endpoint:
Data storages
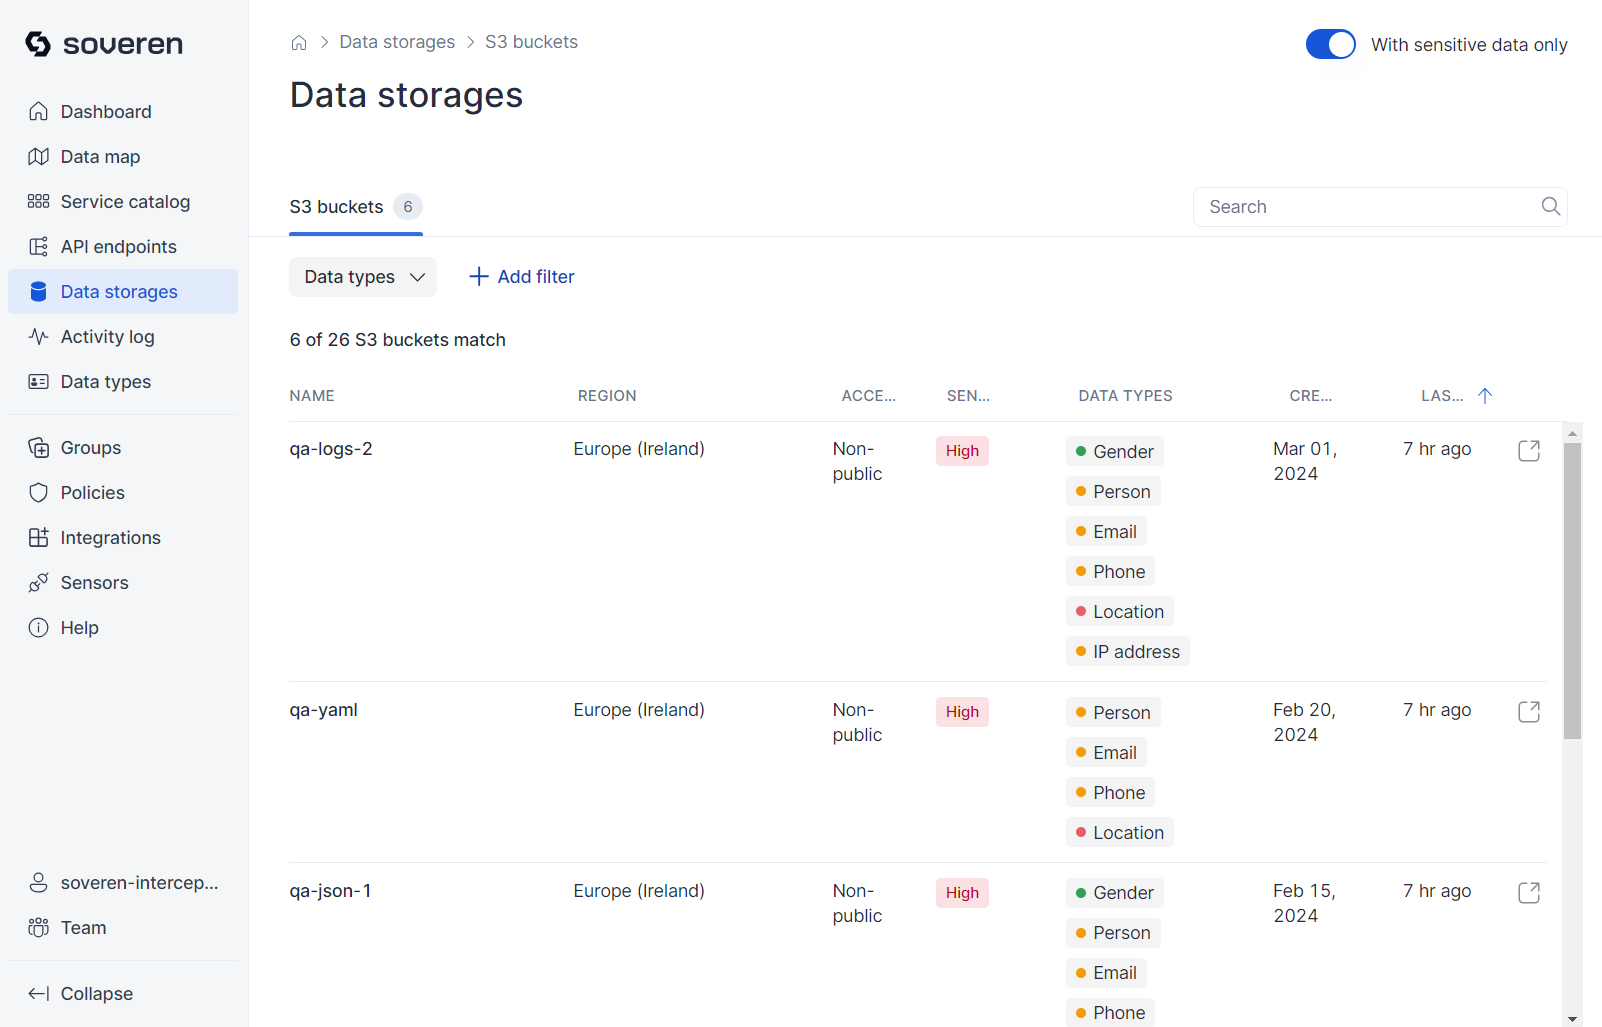
Currently, Soveren includes support for S3 buckets as data storage options.
Browse the list of S3 buckets that Soveren has identified in your AWS account:
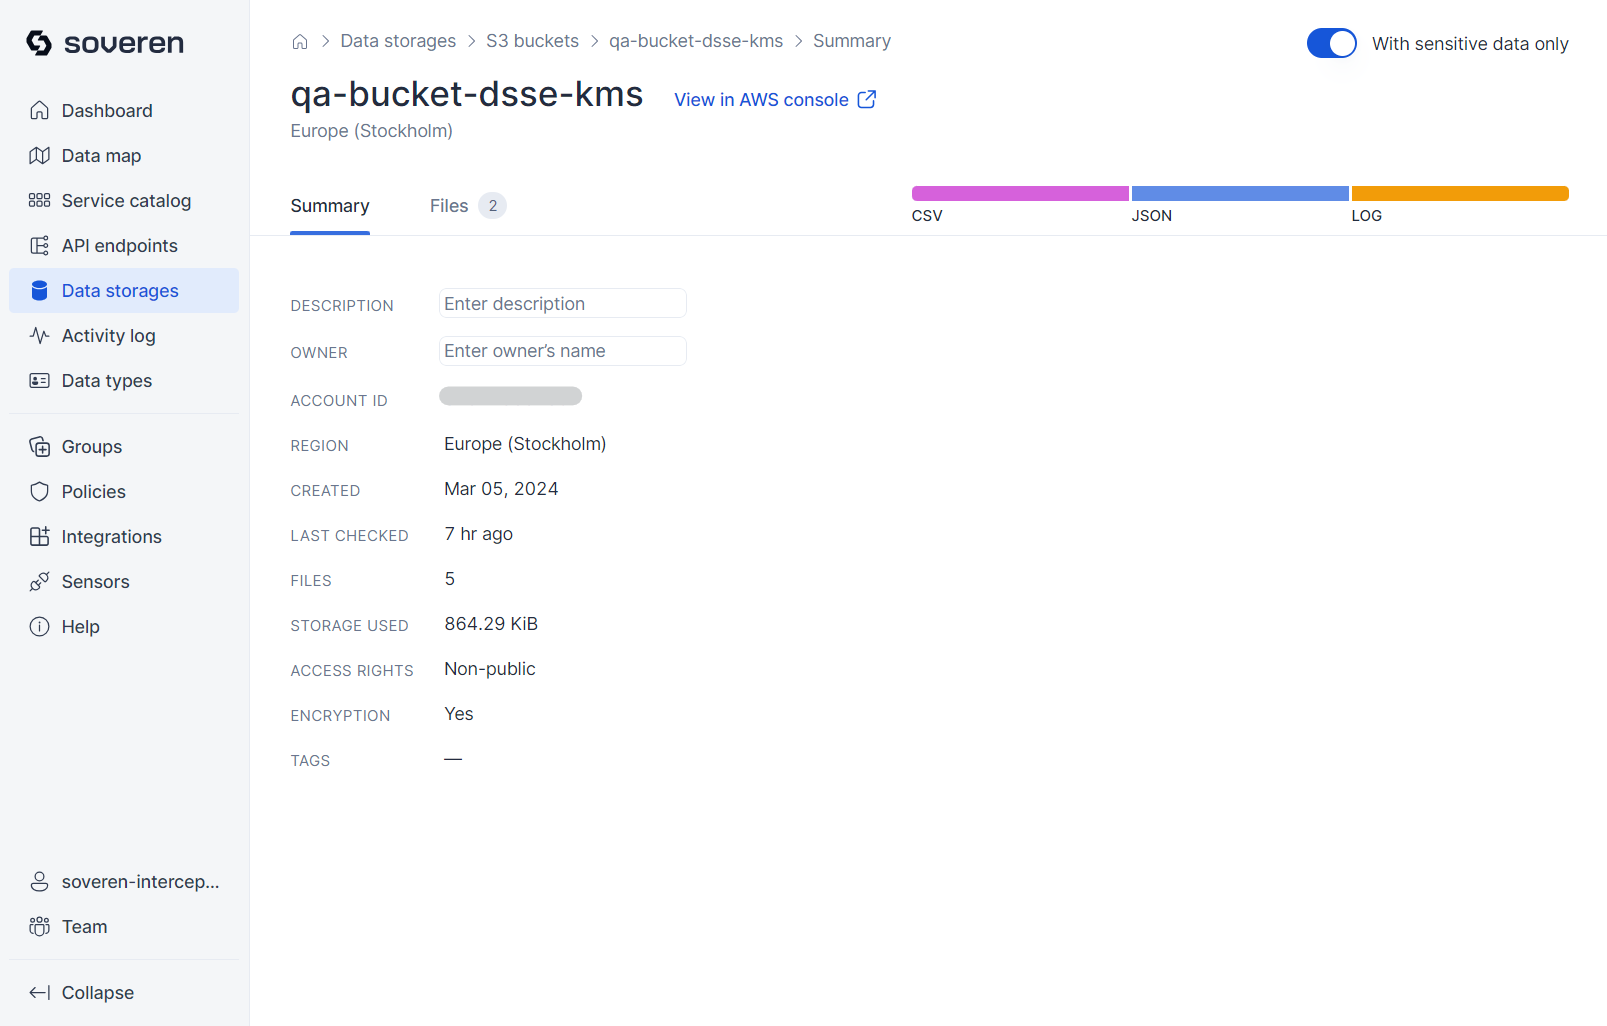
Next, you can review the summary information for each bucket:
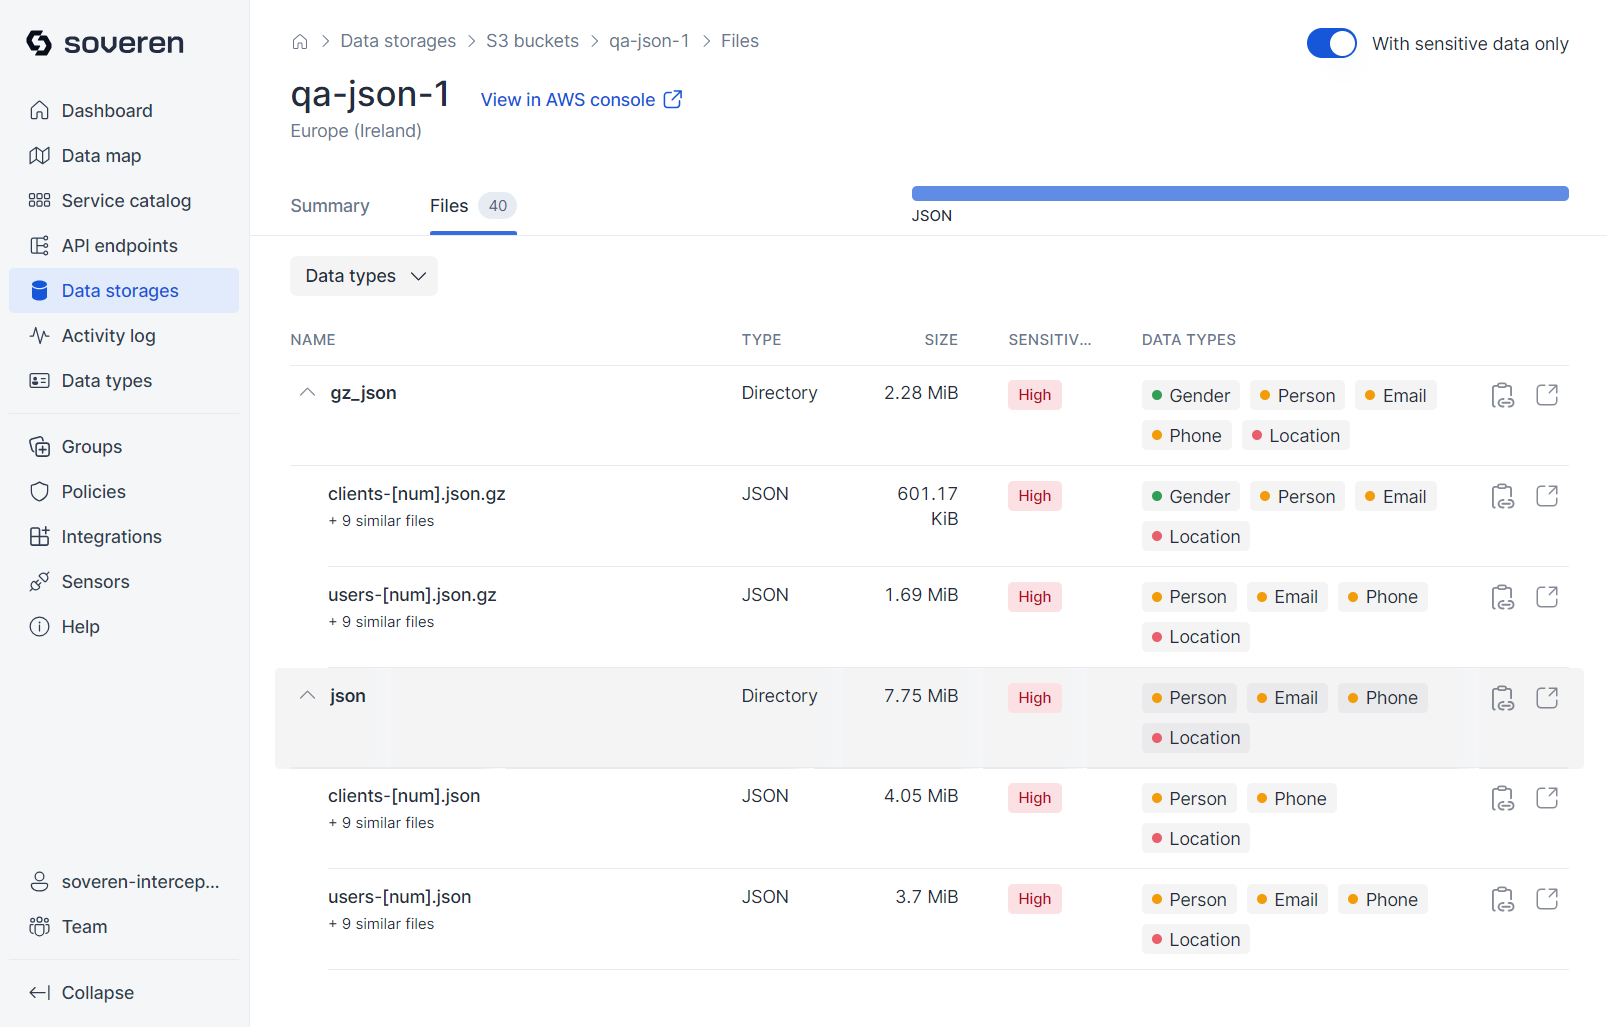
Objects stored in the bucket are grouped (or clustered) based on their key names and MIME types:
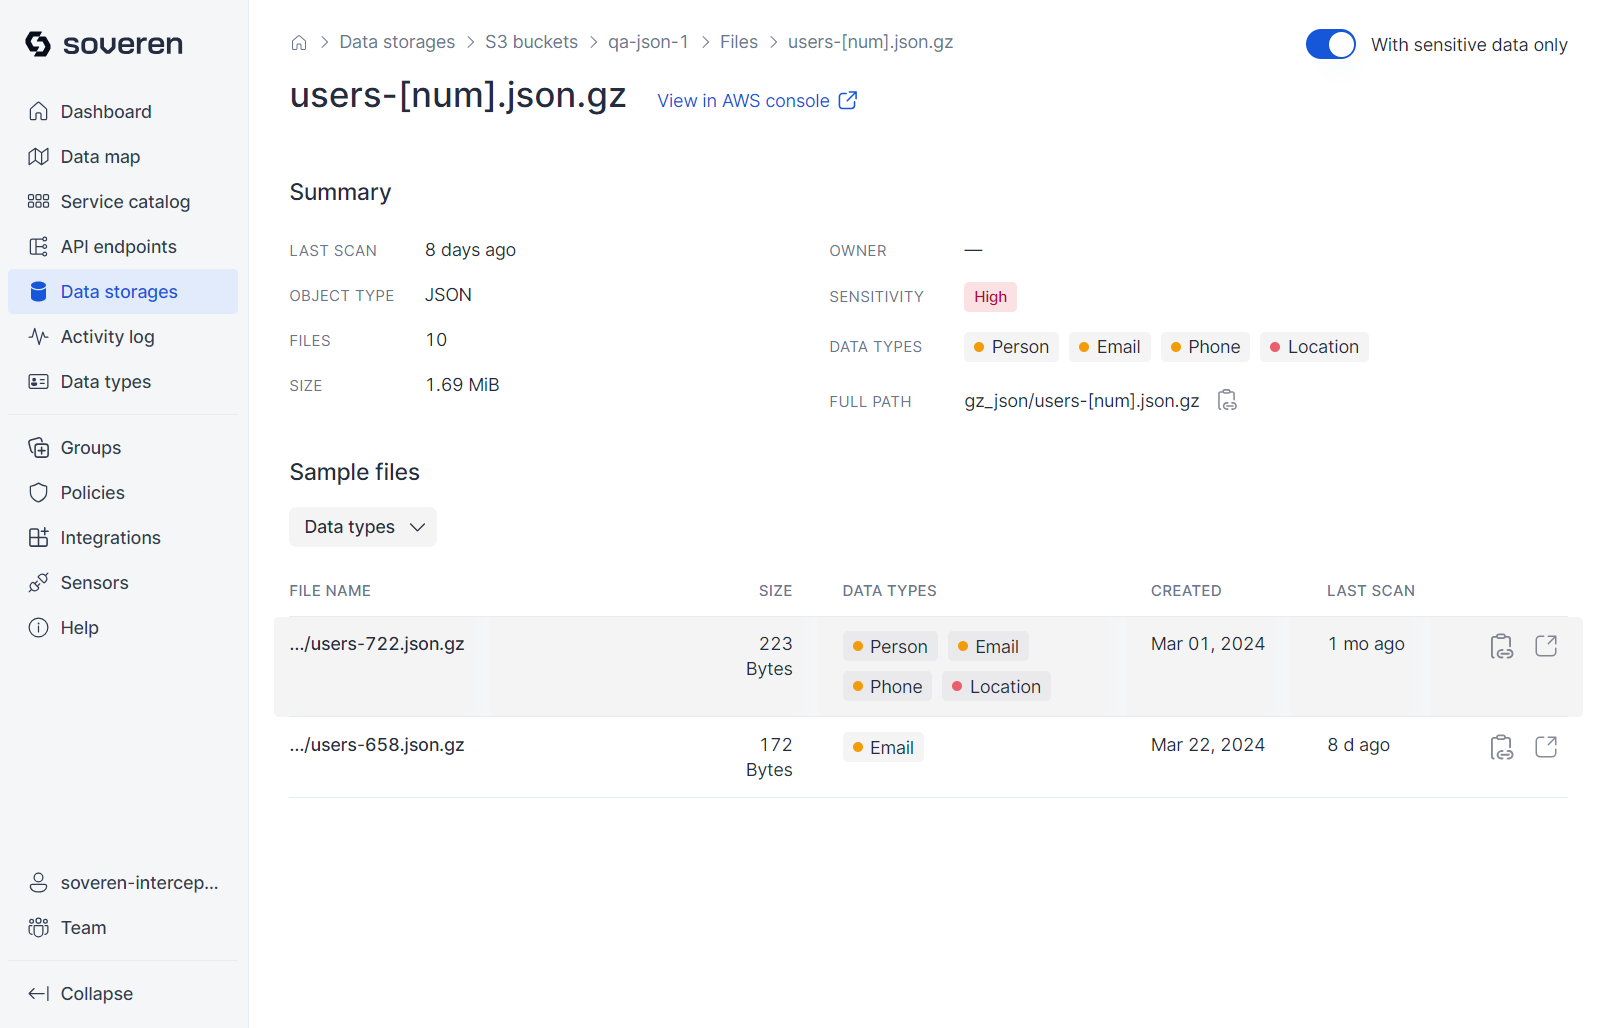
Soveren analyzes samples from the bucket, running detections on their contents:
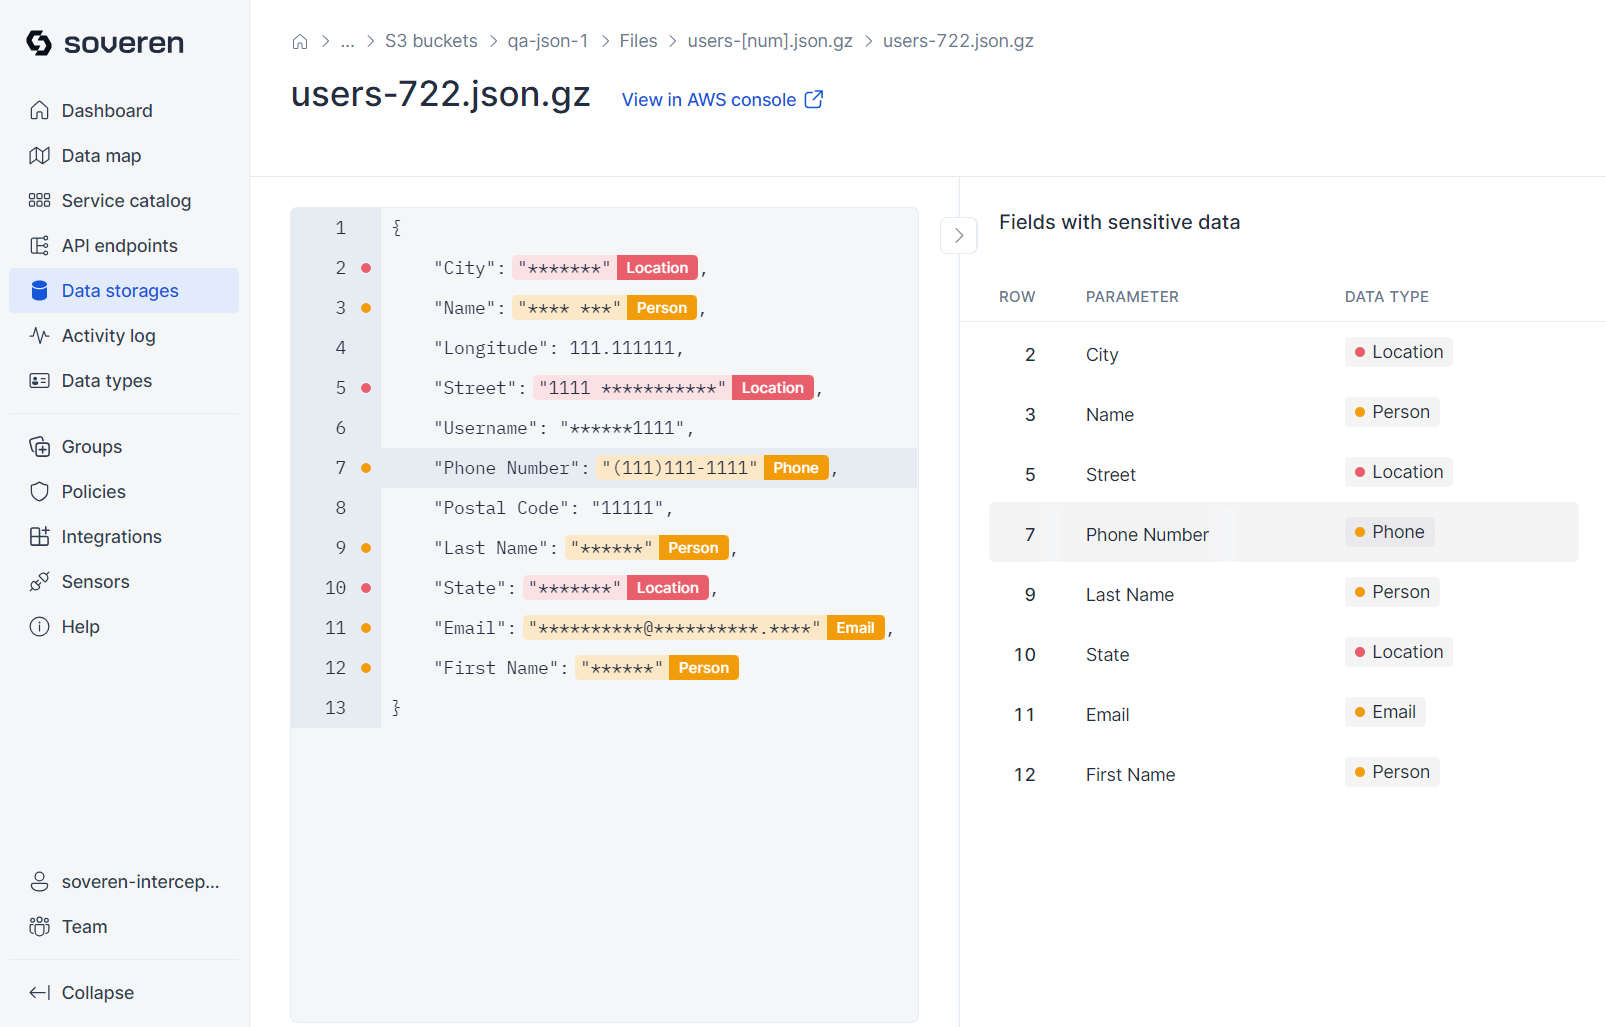
You can then view a sample of the data stored in the bucket:
Activity log
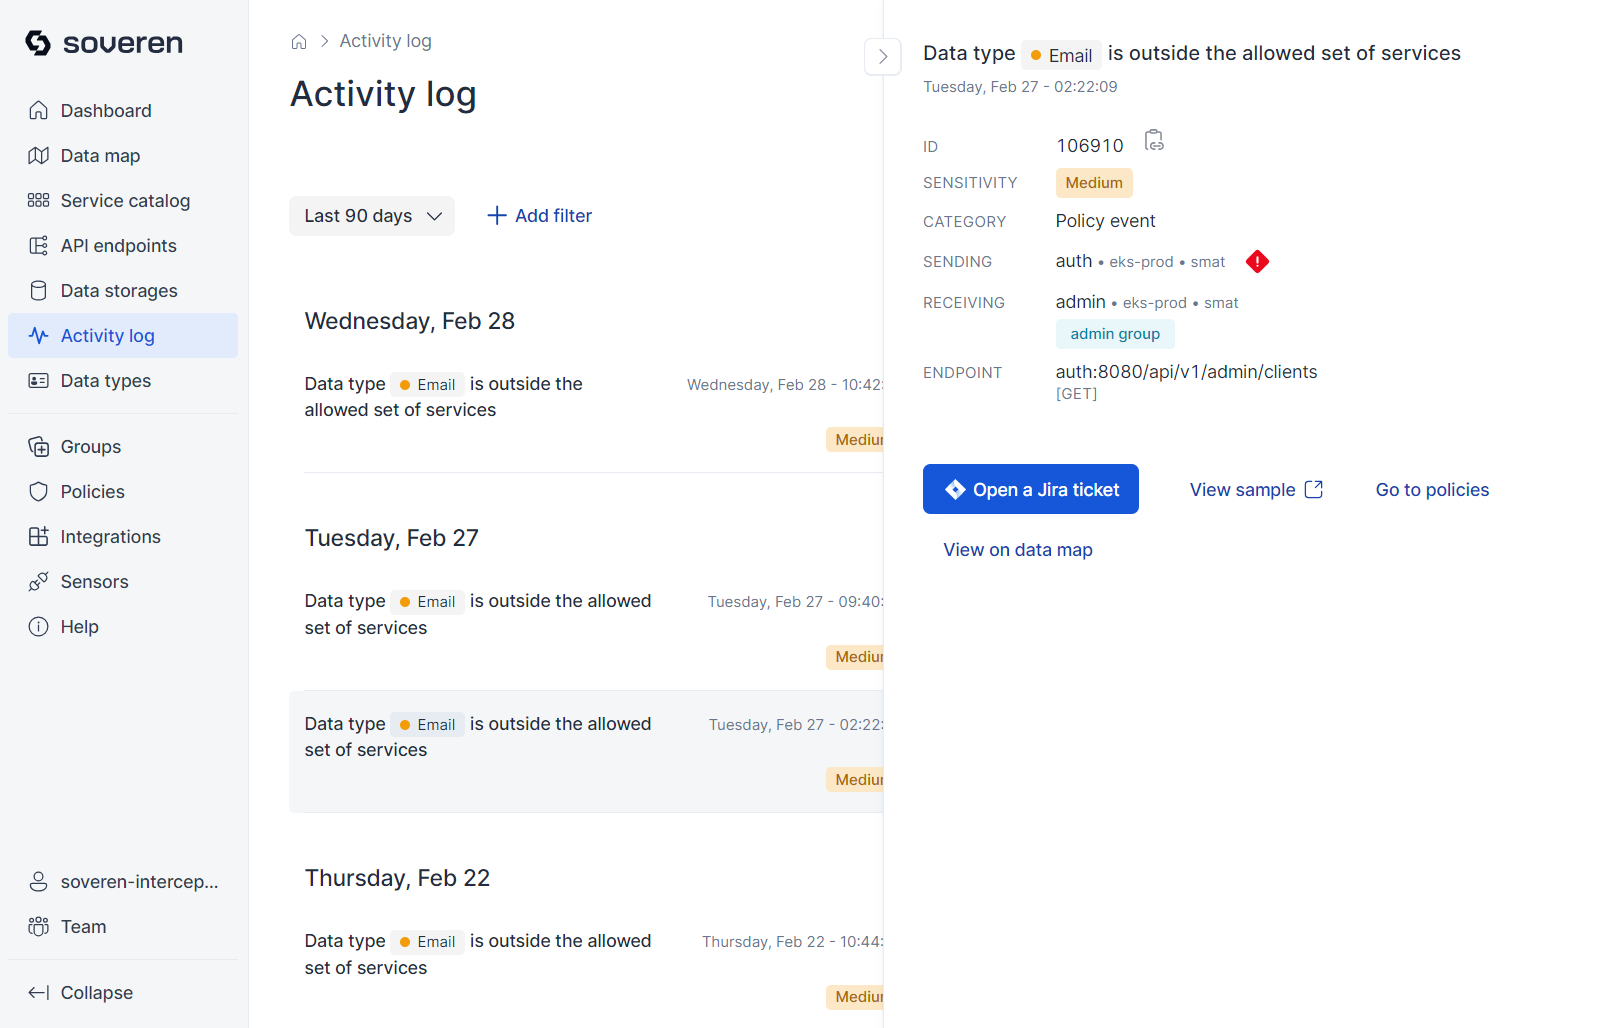
The activity log records significant events identified by Soveren. These events can fall into several categories, notably including violations of predefined policies related to sensitive data exchanges. An example of such an event is the initial detection of a sensitive data type in a specific data flow.
Here is an example of what the activity log might include:
Most information in the activity log is accessible not only through the product's user interface but also via integrations, such as webhooks or Slack alerts.
Data types
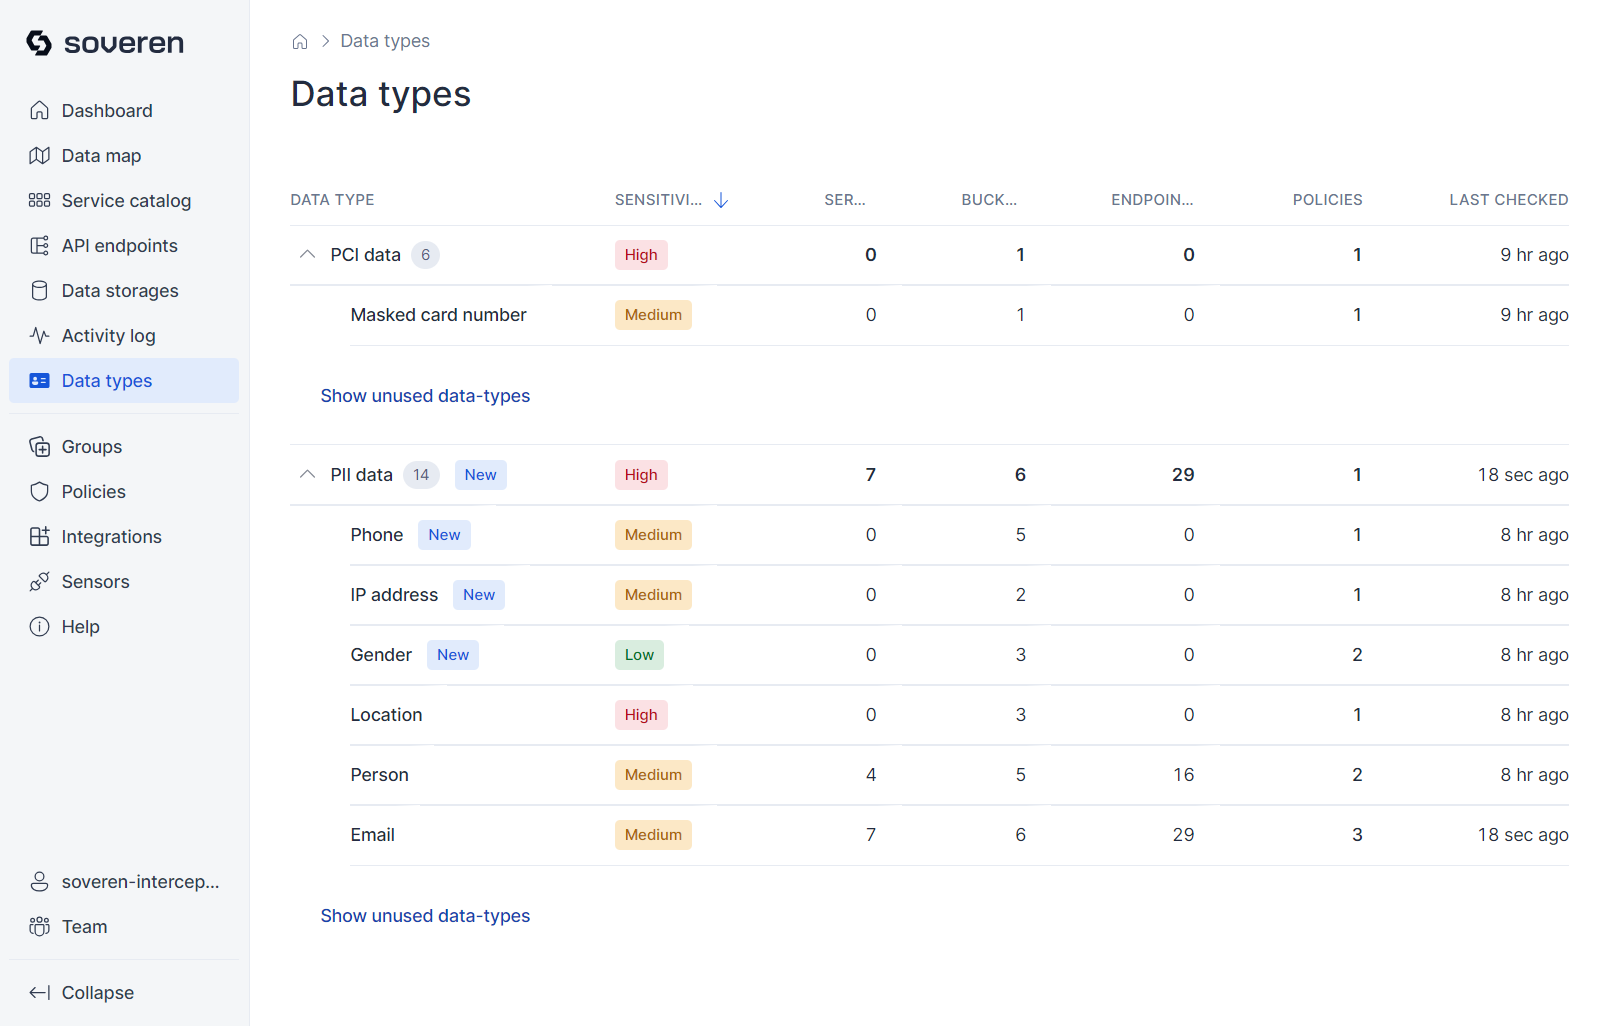
Data types provide a summary of the sensitive data types that the Soveren Sensor has detected in your infrastructure. Soveren supports numerous data types right out of the box, and the range of supported types is continually expanding.
Here's an example of what the data types view looks like:
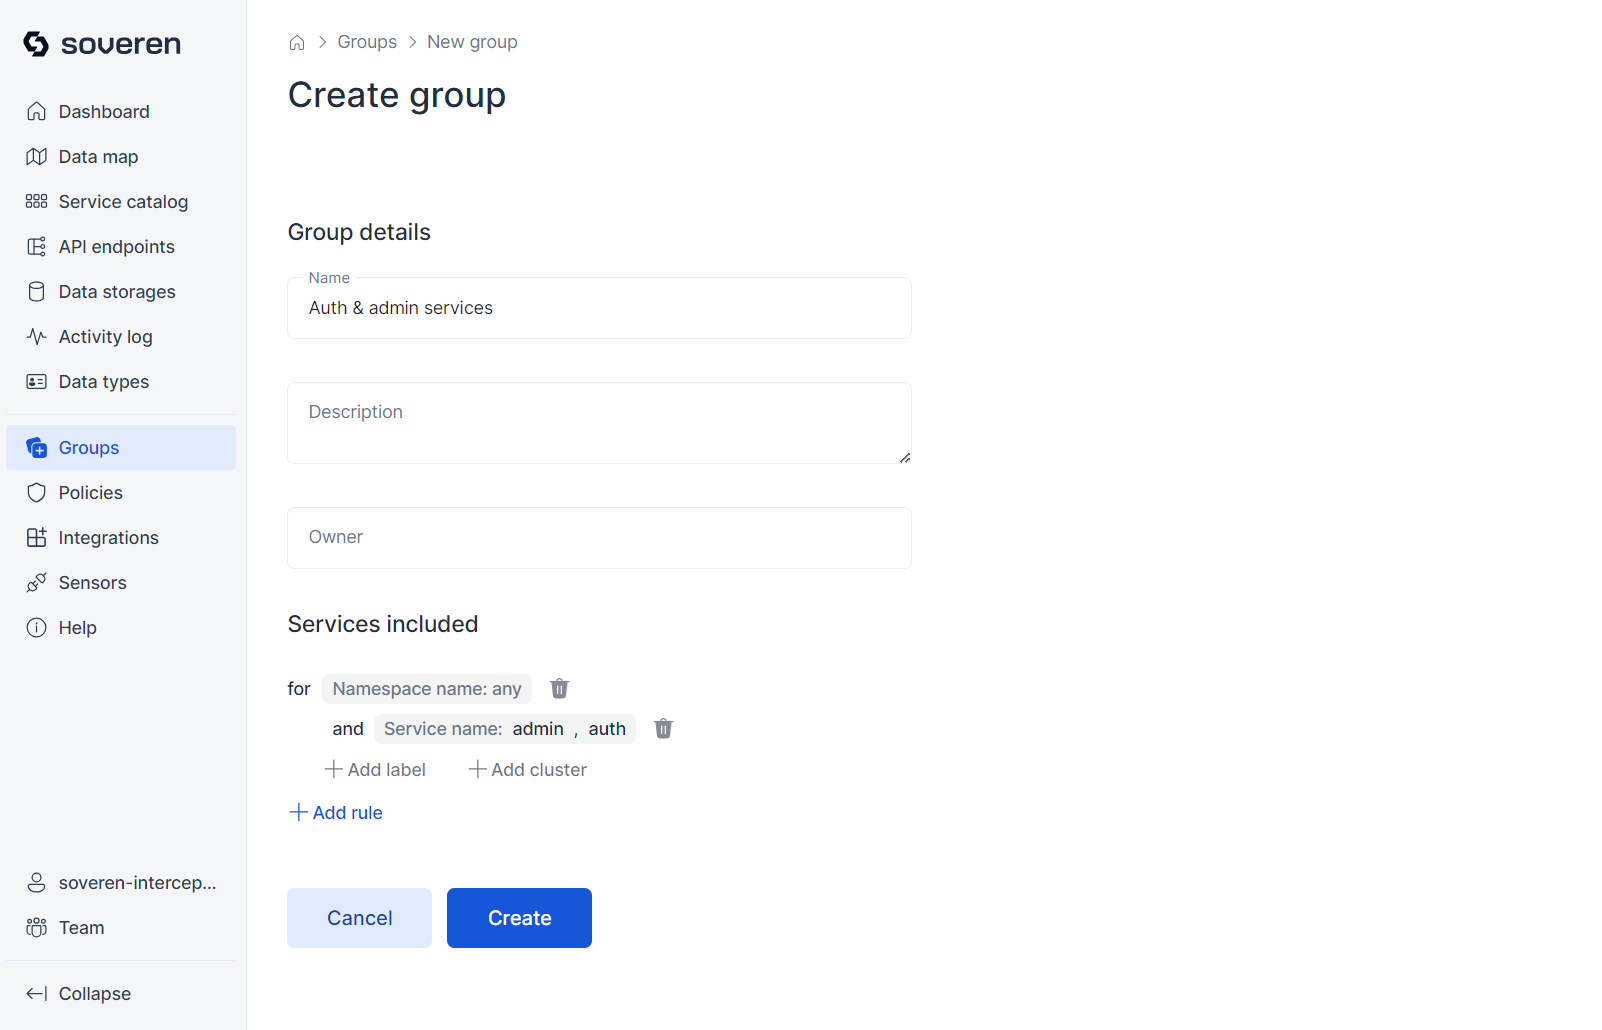
Service groups
You have the option to combine selected services into a custom group, which will then be displayed as a distinct entity on the data map:
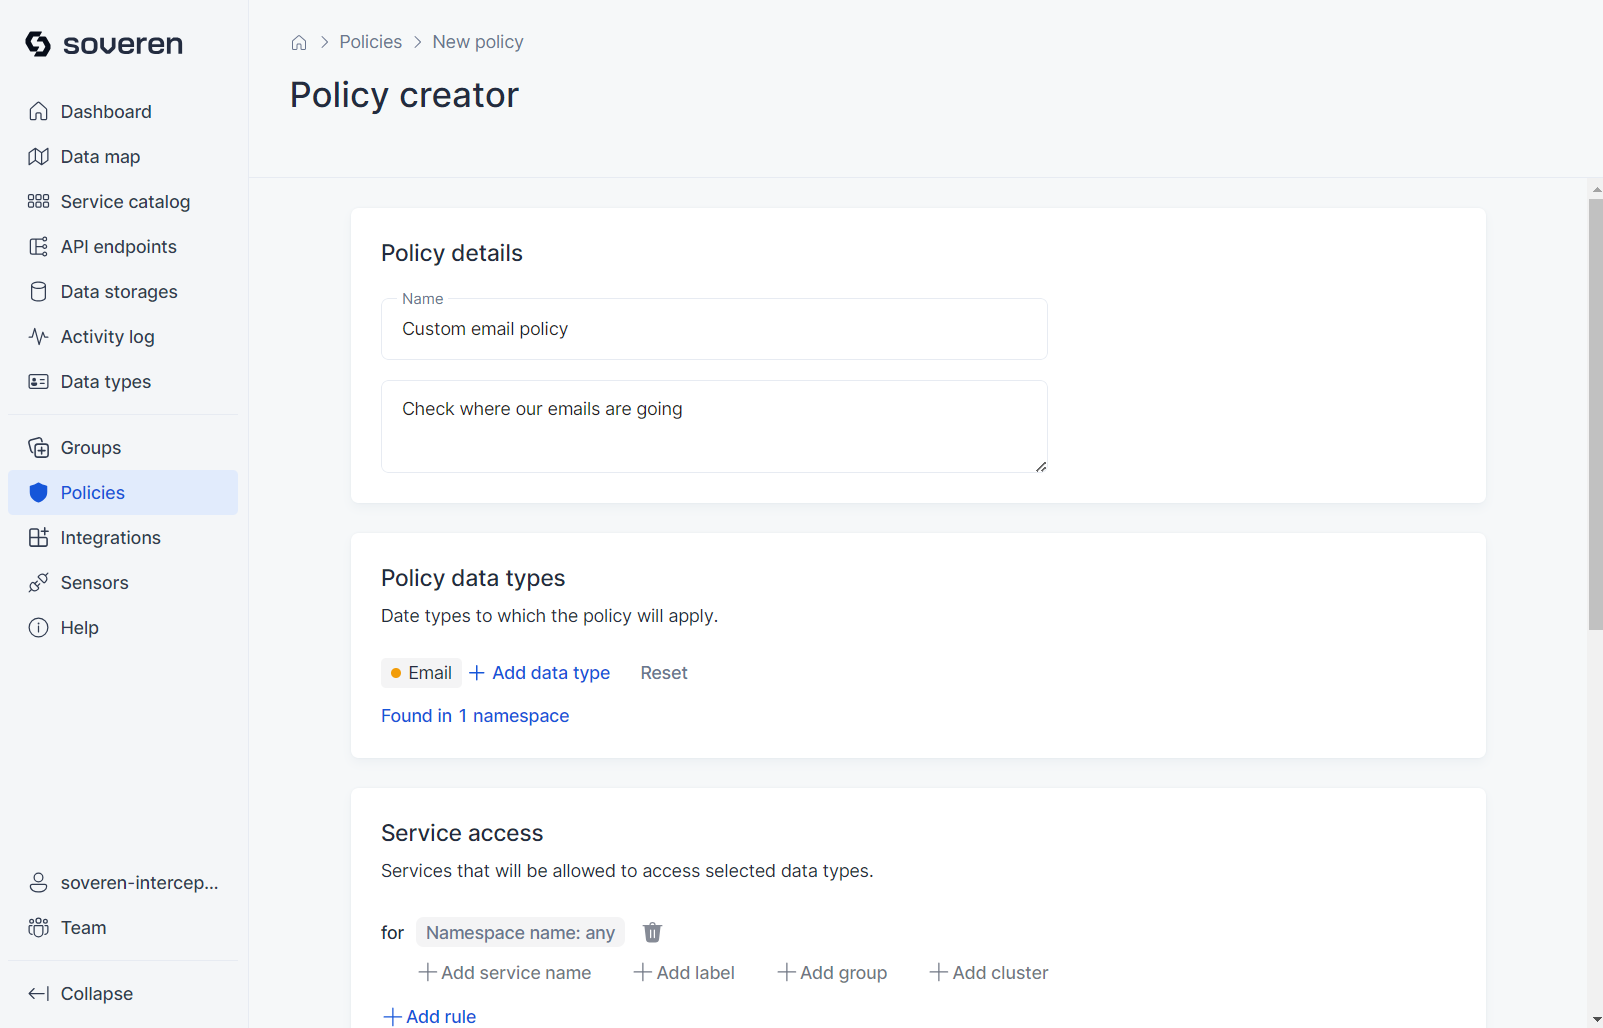
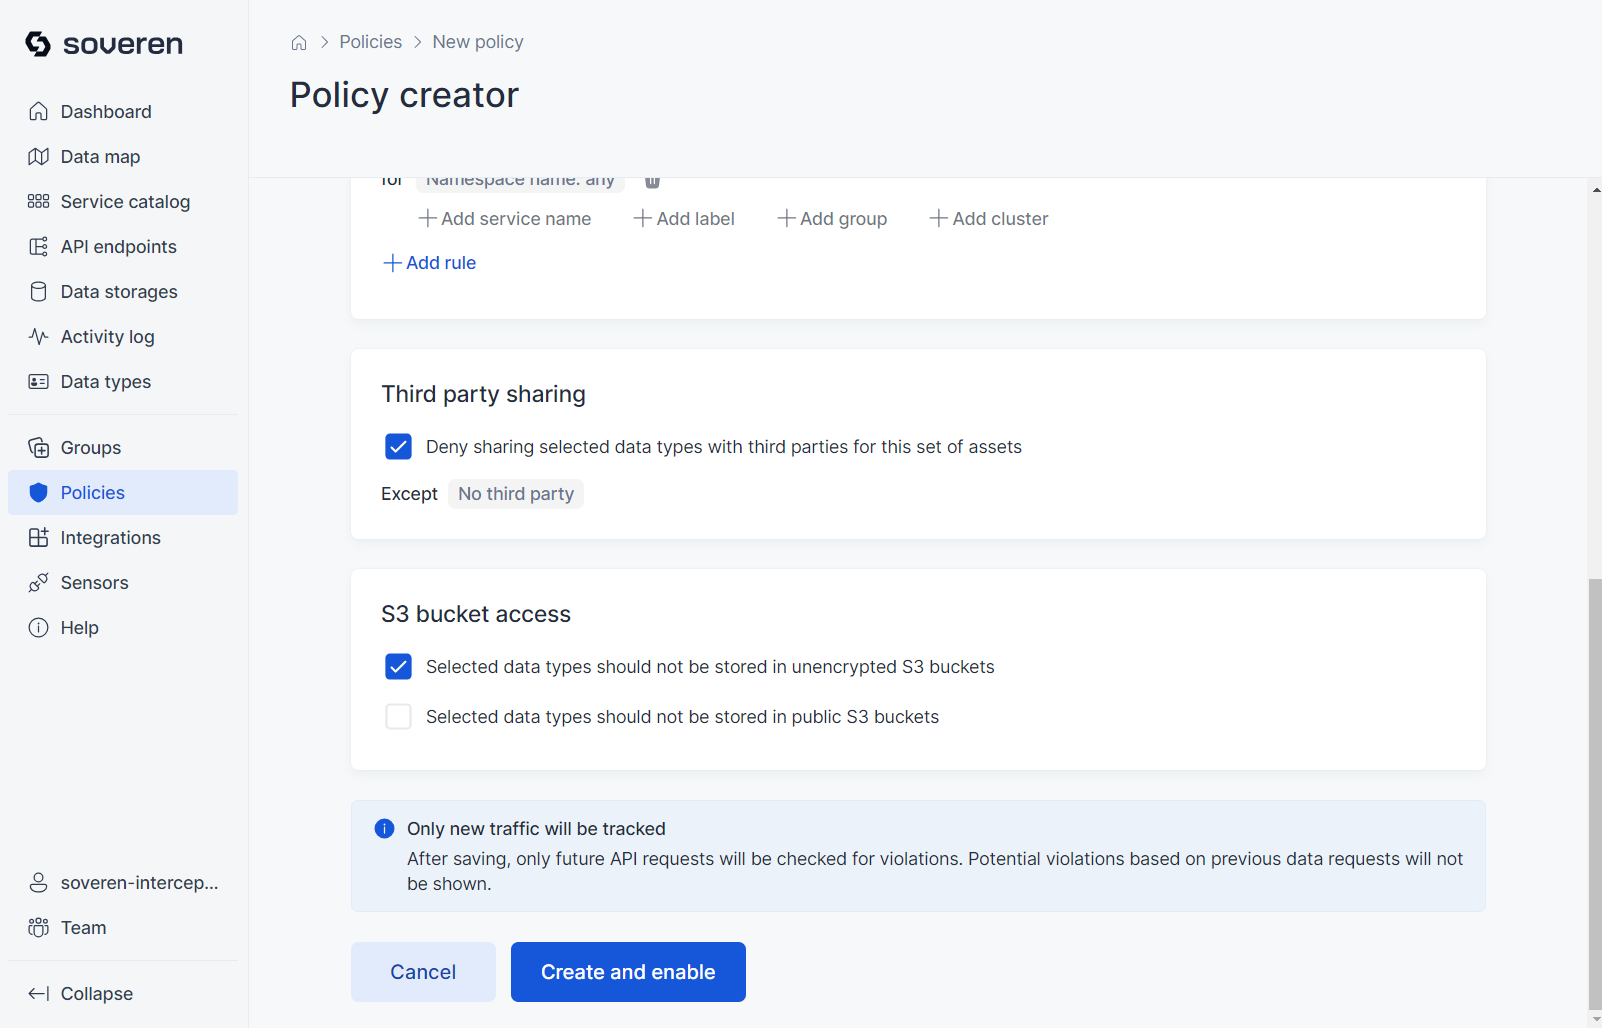
Policies
You can set up policies to automatically monitor which services or data sources are authorized to handle specific data types. Additionally, these policies can restrict the sharing of data with third parties.
How Soveren works with your data
-
The Soveren Sensor does not transmit any personal or sensitive data — in fact, any actual data — outside your environment. What you see on the dashboards is solely metadata about the activities the Sensor has observed. This includes, for example, which service has been communicating with another and what types of sensitive data were present, without including any of the actual data.
-
In the metadata displayed on the dashboards, we mask textual, numerical, and complex data types. This allows you to discern the form of the data that was present without exposing the actual content. This masking is performed within your perimeter and the processed metadata is then sent to the Soveren Cloud.
-
The dashboards provide an overview of the last 7 days. Data older than this period is automatically discarded.
-
Occasionally, you may notice calls to hosts and endpoints that do not exist within your environment, resulting in 4xx or 5xx response codes. These are often generated by internet-crawling robots or hackers probing for vulnerabilities in online resources.
